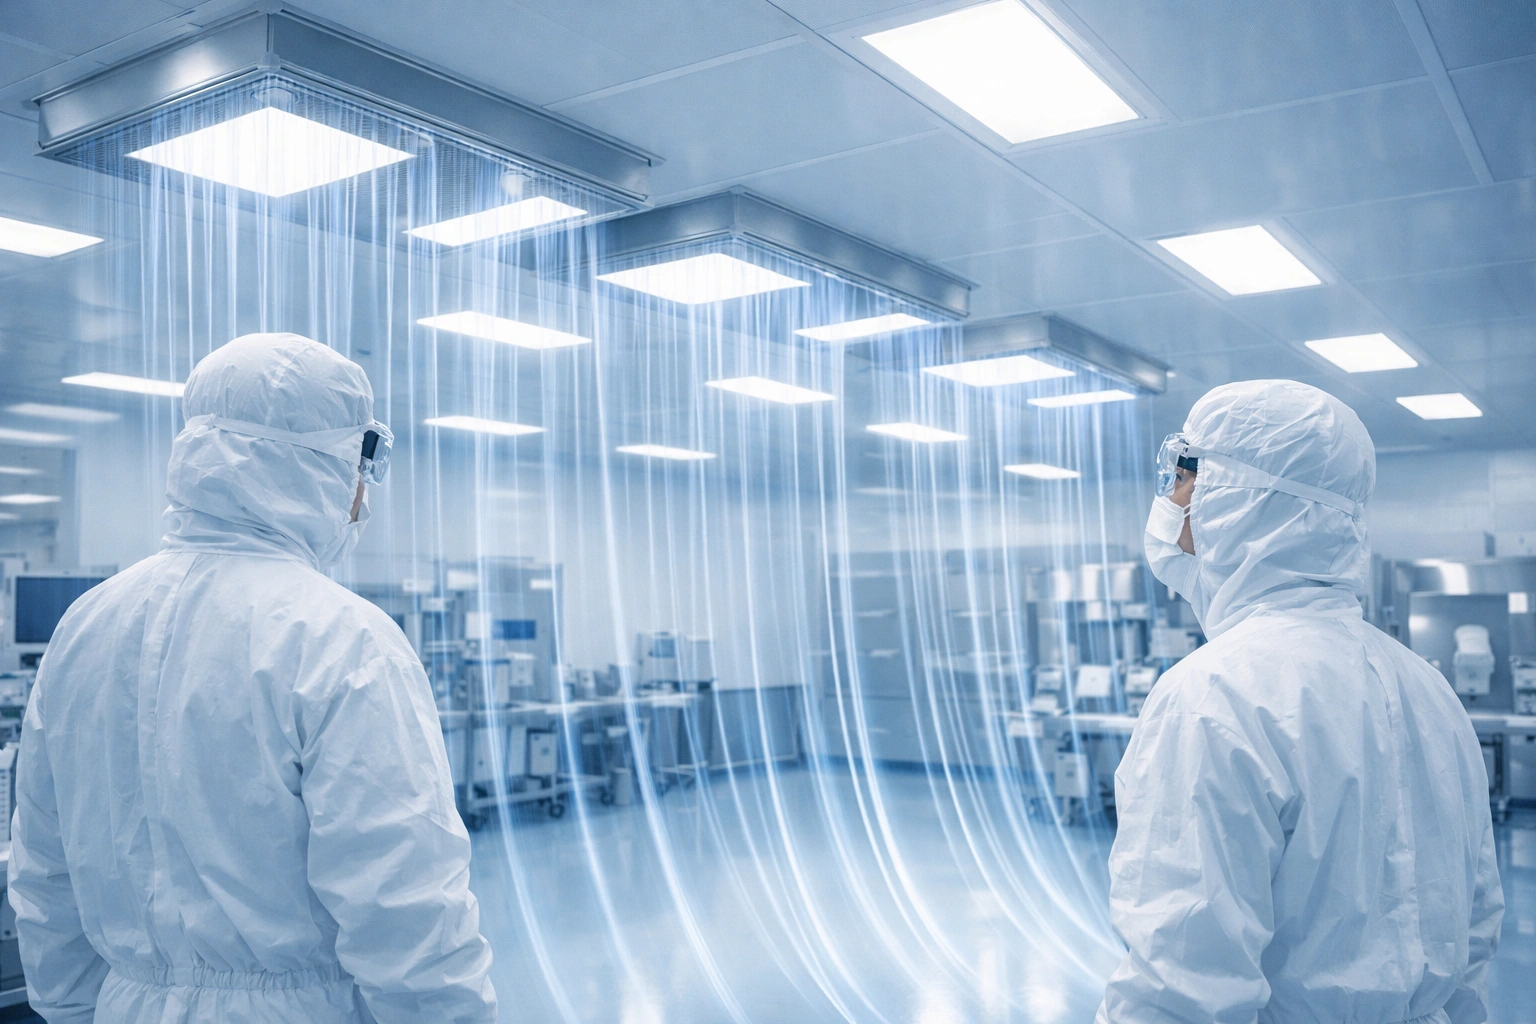
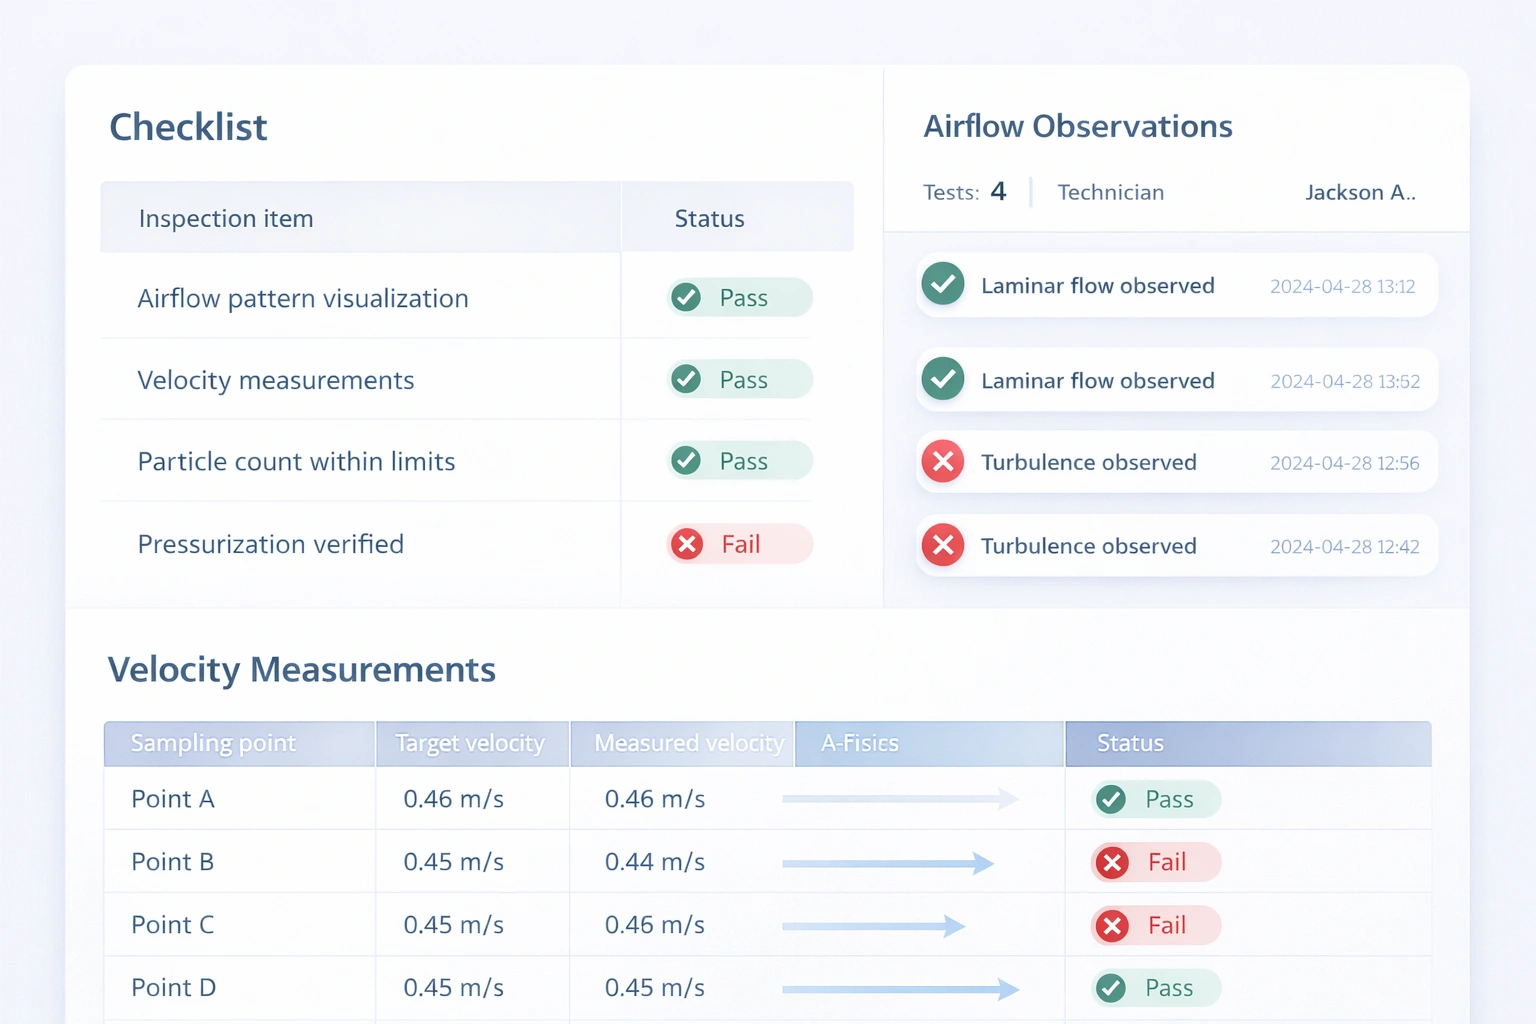
Cleanroom airflow pattern visualization and verification are essential for confirming laminar flow integrity, identifying turbulence or short-circuiting, and protecting critical zones from contamination risk.
In Grade A and other high-control environments, airflow performance is not just an engineering detail. It directly affects particle behavior, intervention risk, environmental monitoring trends, and overall confidence in contamination control. A robust verification approach should combine visual observation, velocity mapping, and documented acceptance criteria.
Cleanroom airflow pattern visualization and verification are used to confirm that air moves through critical zones in the intended way. In practice, this means demonstrating laminar or otherwise acceptable airflow behavior, confirming that there is no visible turbulence or short-circuiting, and verifying that airflow velocity and uniformity remain within the required range for the cleanroom grade.
The most useful programs combine smoke studies, particle trace methods, and velocity mapping so that teams can see airflow behavior, measure performance, document findings, and correct airflow failures before they affect product or process quality.
Airflow is one of the main mechanisms that separates a controlled cleanroom environment from an uncontrolled one. In critical processing areas, properly directed airflow helps sweep particles away from exposed product or process contact surfaces. When airflow becomes unstable, non-uniform, obstructed, or bypassed, contamination risk rises quickly.
This is why airflow pattern verification is treated as a critical part of contamination control, especially for Grade A (ISO 5) zones and other high-risk operations. It supports qualification, routine review, deviation investigation, HVAC troubleshooting, and post-maintenance confirmation. Your original article already places airflow visualization at the center of laminar flow verification, smoke studies, particle trace analysis, and velocity mapping. :contentReference[oaicite:2]{index=2}
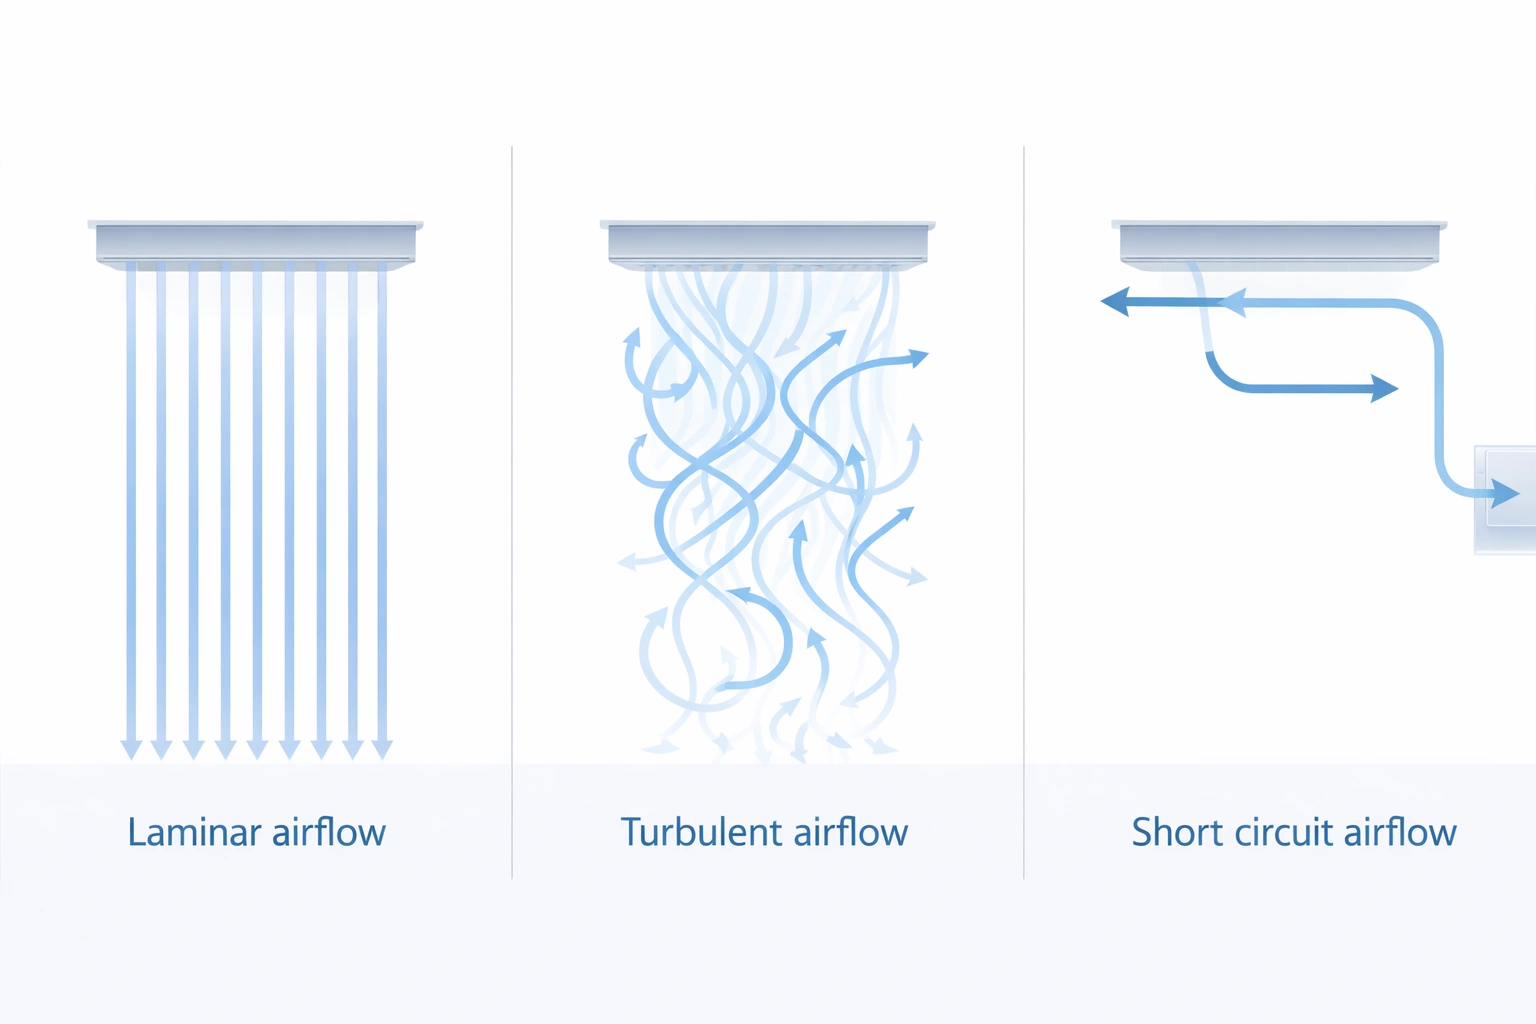
Before testing begins, teams should define what acceptable airflow looks like in the target zone. The most common comparison is between laminar airflow, turbulent airflow, and short-circuit airflow. Your source content uses these three categories as the core conceptual framework. :contentReference[oaicite:3]{index=3}
Unidirectional, parallel flow with minimal mixing. This is the preferred pattern for Grade A and other critical zones where contamination control depends on stable sweep behavior.
Chaotic, mixed flow with eddies and unstable particle movement. This increases contamination risk and can indicate obstruction, poor balancing, or excessive velocity.
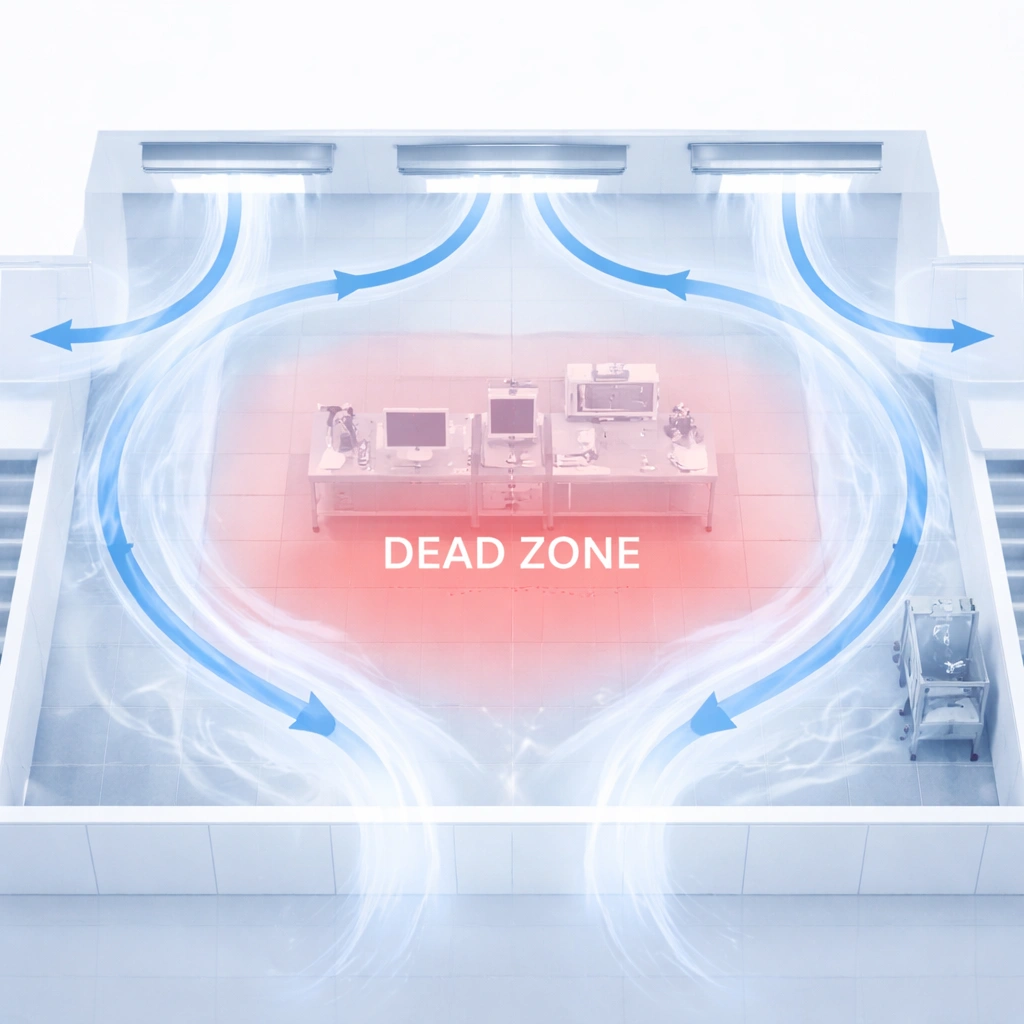
Air bypasses the critical zone and moves directly from supply toward return, leaving poorly protected areas and dead zones behind.
| Zone | Preferred Airflow Type | Typical Velocity Range | Uniformity Target |
|---|---|---|---|
| Grade A / ISO 5 | Laminar / Unidirectional | 0.36 ± 0.09 m/s | ±20% of mean |
| Grade B / ISO 7 | Laminar preferred | 0.1–0.4 m/s | ±20% of mean |
| Grade C / ISO 8 | Turbulent acceptable | 0.1–0.4 m/s | ±30% of mean |
| Grade D / ISO 9 | Turbulent acceptable | 0.1–0.4 m/s | ±30% of mean |
The most practical verification programs combine qualitative and quantitative methods. Your article highlights smoke tests, particle trace methods, and anemometer-based mapping as the main tools for structured airflow verification. :contentReference[oaicite:4]{index=4}
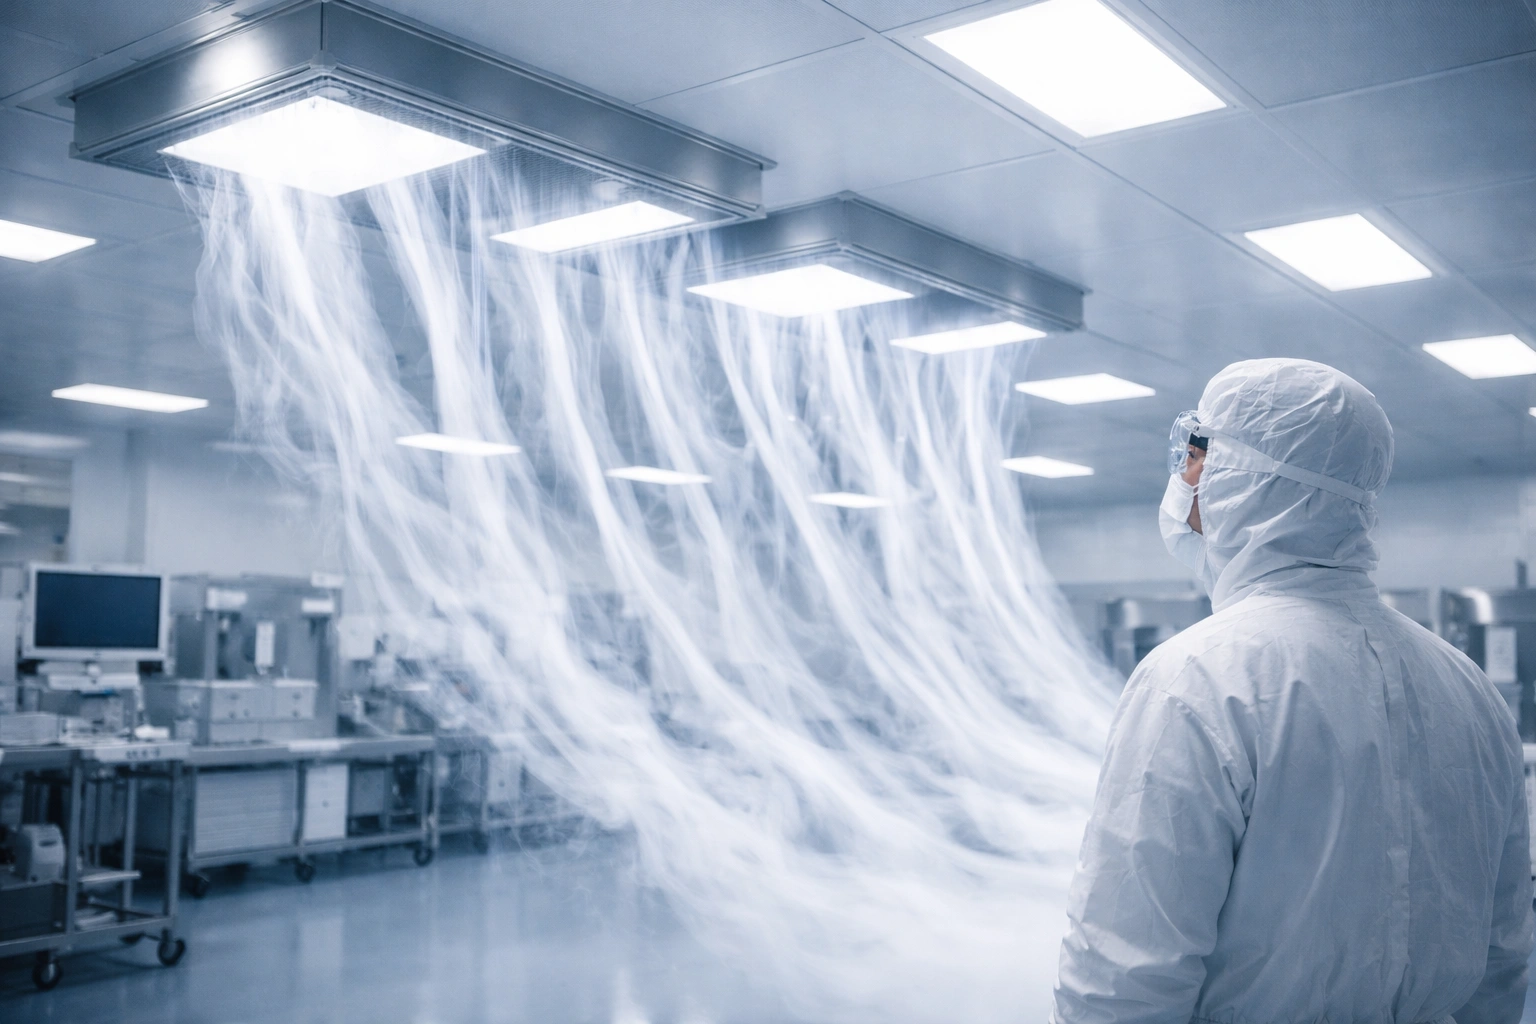
Smoke visualization remains the most widely recognized way to observe airflow behavior directly. A controlled smoke stream released near the HEPA filter or test point helps reveal whether flow is smooth, uniform, and protective, or whether it breaks down into eddies, obstructions, and bypass paths.
Particle trace methods add a more quantitative layer by monitoring particle movement and concentration through the airflow path. This can help confirm recirculation, bypass, or non-uniform behavior that may not be fully appreciated through visual smoke patterns alone.

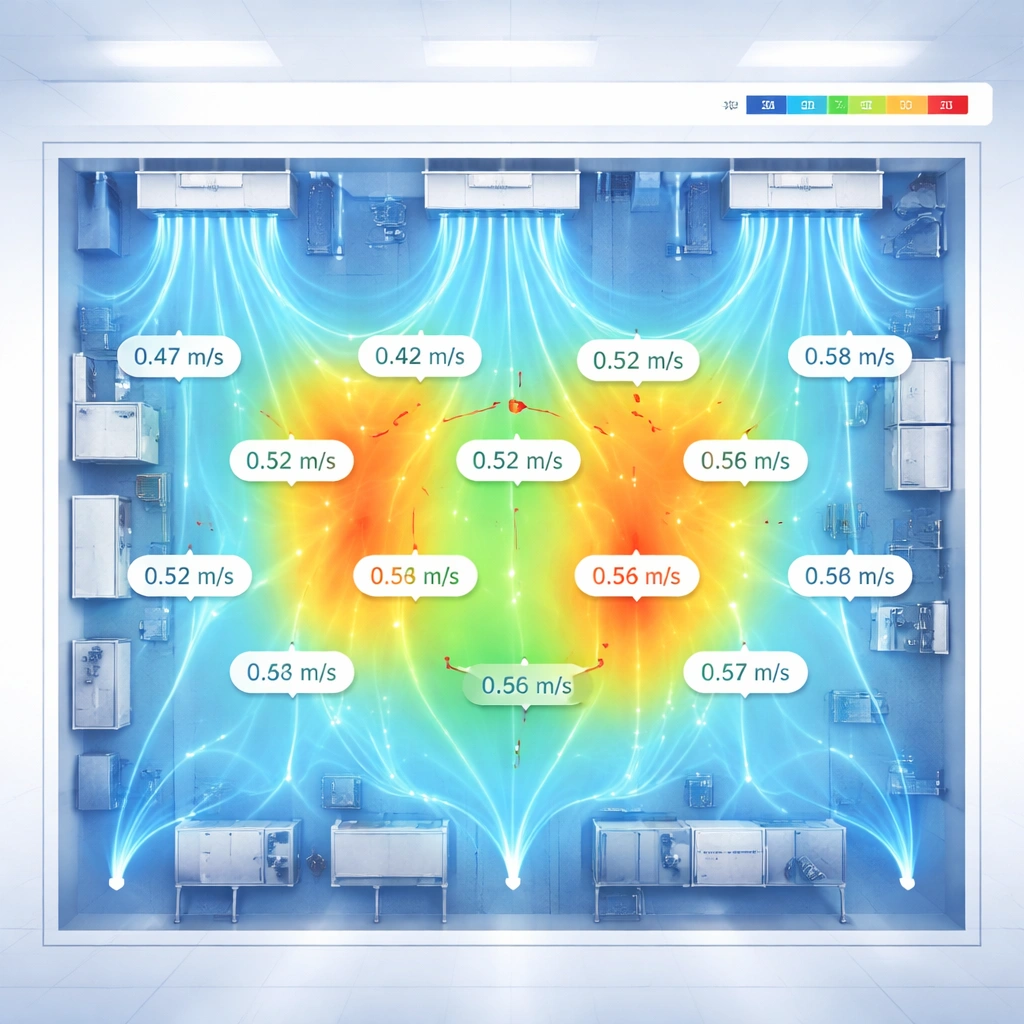
Velocity mapping provides the numerical evidence needed to confirm uniformity. It is particularly important when a zone visually appears acceptable but still produces uneven protection due to weak spots, excessive speed, or local imbalance.
A useful verification protocol should define pre-checks, test points, observation method, recording format, acceptance criteria, and remediation logic. It should also clarify whether testing is performed at rest, under operational conditions, or as part of qualification or requalification.
Acceptance criteria should reflect both engineering performance and contamination-control intent. Your original framework identifies flow type, visible turbulence, short-circuiting, velocity uniformity, velocity range, obstructions, and recirculation as the core evaluation criteria. :contentReference[oaicite:5]{index=5}
| Criterion | Target | Evaluation Method |
|---|---|---|
| Flow Type | Laminar / unidirectional where required | Visual observation |
| Visible Turbulence | None in critical path | Smoke study / direct observation |
| Short-Circuiting | Not acceptable in protected zone | Smoke study / particle trace |
| Velocity Uniformity | Within ±20% of mean for Grade A | Anemometer mapping |
| Velocity Range | Within specified target range | Anemometer mapping |
| Obstructions | No unacceptable blockage of protective flow | Visual inspection |
| Recirculation | No critical dead zones | Smoke study / particle trace |
Airflow failures are often caused by real-world operational factors rather than design intent alone. Equipment placement, stored materials, personnel positioning, degraded filters, and imbalance in return paths can all change airflow patterns significantly. Your source article identifies obstructions, short-circuiting, turbulence, non-uniform velocity, and recirculation as the main recurring failure types. :contentReference[oaicite:6]{index=6}
| Failure Type | Typical Cause | Likely Effect |
|---|---|---|
| Obstruction | Equipment, storage, personnel | Turbulence and reduced contamination protection |
| Short-Circuiting | Poor filter/return relationship, open doors, gaps | Bypass of critical zone |
| Turbulence | High velocity, poor diffuser behavior, obstruction | Increased particle movement and unstable protection |
| Non-Uniform Velocity | Damper issue, filter degradation, imbalance | Uneven airflow protection |
| Recirculation | Dead zones, poor return design | Particle accumulation and local contamination risk |
Corrective action should be matched to the airflow failure mechanism. Not every problem requires redesign, but every significant failure should trigger documented review and follow-up verification.
Remove unnecessary obstructions, reposition movable equipment, clear aisles, close inappropriate openings, and control personnel flow.
Adjust dampers, rebalance airflow, investigate weak HEPA performance, reduce over-velocity, and recheck differential pressure.
Modify return-air design, add baffles or flow-straightening features, replace degraded filters, and update room layout if persistent failures remain.
Verification records should be clear enough that another reviewer can understand what was tested, under what condition, how the airflow behaved, what acceptance criteria were applied, and whether corrective action was necessary.
This is especially useful during qualification, deviation investigation, contamination trending, and customer or regulatory audits.
Grade A zones are commonly reviewed at least annually, with additional testing after maintenance, filter replacement, layout changes, or contamination-related events.
Smoke testing provides direct visual evidence of airflow direction and disturbance. Particle trace analysis adds a more quantitative layer by showing how particles move and accumulate within the airflow path.
Many programs use 0.36 ± 0.09 m/s as a practical target range for Grade A unidirectional airflow, with uniformity expectations typically set around ±20% of mean.
Obstruction, short-circuiting, turbulence, non-uniform velocity, and recirculation are among the most common failure modes in cleanroom airflow studies.
That depends on the zone and the purpose of the study. Critical Grade A studies are typically performed under carefully controlled conditions, while some supporting areas may be assessed differently according to site procedure.
Midposi supports regulated buyers with cleanroom consumables and documentation-oriented communication for controlled environments, including qualification support, material review, and contamination-control discussions.