Featured Snippet Answer
Cleanroom MOPS alert management is a structured process for identifying, assessing, and responding to abnormal alerts from cleanroom monitoring systems. According to GMP Annex 1 requirements, effective alert management requires acknowledgment within 15-30 minutes, preliminary investigation within 2 hours, detailed report within 24 hours, and a continuous improvement closed-loop mechanism to prevent recurrence.
Introduction: Why Alert Management is "Nerve Center" of MOPS Systems
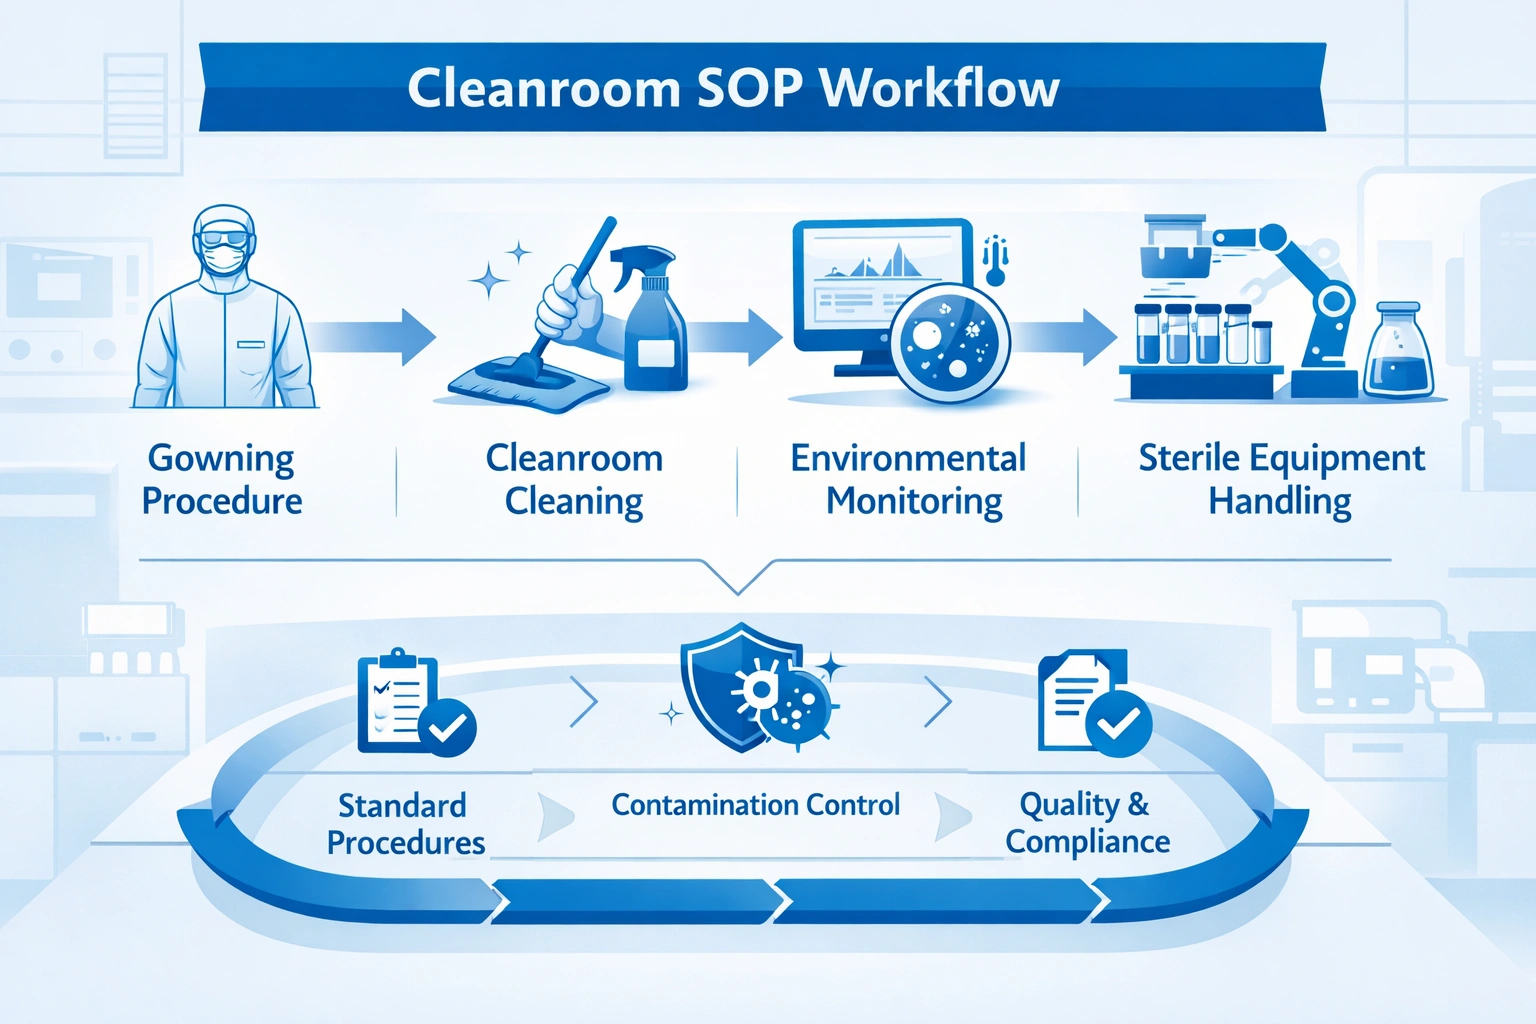
Cleanroom MOPS alert response workflow showing four-phase process from alert detection through acknowledgment, investigation, root cause analysis, to resolution and prevention
In pharmaceutical and biotechnology cleanrooms, installing advanced MOPS (Monitoring and Operation Systems) is only the first step. What truly tests an organization's compliance and quality management maturity is how to handle every alert issued by the MOPS system.
Most existing articles focus on:
- How to install MOPS equipment ✓ (already covered)
- How to validate MOPS systems ✓ (already covered)
- How to develop monitoring plans ✓ (already covered)
But a critically overlooked area is: What do you do when an alert sounds?
This article will provide a complete, actionable alert management and response protocol framework—a topic that competitors rarely explore in depth. As discussed in our complete contamination control strategy, effective alert management is a cornerstone of modern pharmaceutical quality systems.
1. Cleanroom MOPS Alert Management Architecture

Three-tier alert classification decision tree showing Critical (red), Warning (yellow), and Informational (blue) alert levels with corresponding response times and responsible personnel
1.1 Three-Tier Alert Classification System
| Alert Level | Definition | Response Time | Responsible Person |
|---|---|---|---|
| Critical (Red) | Direct product impact, e.g. ISO 5 area particulate exceedance | ≤15 minutes | Duty QA / Production Manager |
| Warning (Yellow) | Trending anomaly, e.g. 3 consecutive readings near limit | ≤60 minutes | Environmental Monitoring Specialist |
| Informational (Blue) | System notification, e.g. calibration due reminder | ≤24 hours | Equipment Maintenance Staff |
Understanding the difference between particle vs microbial contamination is essential for proper alert classification. Each contamination type requires different response protocols and investigation methods.
1.2 Four Major Alert Source Categories
Environmental Parameter Alerts
- Particle counter exceedance (ISO 14644-1 limits)
- Temperature/humidity out of range
- Differential pressure anomaly (≤0.05Pa or outside set range)
- Airflow velocity changes
Microbial Alerts
- Active settle plate exceedance
- Surface microbial test result anomaly
- Personnel microbial monitoring failure
- Aseptic process simulation failure
Equipment System Alerts
- Sensor calibration failure
- Data transmission interruption
- Power anomaly
- Software version mismatch
Operational Procedure Alerts
- Personnel not following entry/exit procedures
- Cleaning operation timeout
- Missing documentation
- SOP deviation records
For a deeper understanding of sources of contamination that trigger these alerts, refer to our contamination control resources.
2. From Alert to Resolution: Standard Response Protocol (SOP)
2.1 Phase 1: Alert Acknowledgment (0-15 minutes)
Acknowledge alert receipt within 15 minutes of notification
Record alert time, type, location
Notify relevant team members
Preliminary risk assessment
If involving Grade A/B areas, suspend related operations

Decision tree showing immediate actions when critical alert sounds, with branches for product contact areas vs non-critical areas and corresponding response protocols
Critical Decision Tree
Alert sounds → Does it involve direct product contact areas?
                ↓
         Yes → Suspend operations immediately → Initiate deviation investigation
                ↓
         No → Continue monitoring → Complete preliminary investigation within 2 hours
This rapid response framework builds upon the Cleanroom MOPS implementation guide and aligns with GMP Annex 1 requirements for immediate intervention in critical situations.
2.2 Phase 2: Preliminary Investigation (15 minutes - 2 hours)
Data Collection Template
## Alert Preliminary Investigation Report

Alert Number: ALERT-2026-001
Alert Time: 2026-03-21 14:32:15
Alert Level: Critical/Warning/Informational

**I. Basic Information**
- Alert Type: [Particulate/Microbial/Temperature/Pressure/Other]
- Monitoring Point Location: [Specific area/room number]
- Exceedance Degree: [Measured value vs limit]
- Duration: [X minutes/hours]

**II. On-site Investigation**
- Operator: [Name/ID]
- Ongoing Activity: [Description]
- Equipment Status: [Normal/Abnormal]
- Environmental Conditions: [Description]

**III. Historical Data Review**
- Historical exceedance records at this point: [Count/time]
- Adjacent point data in same period: [Trend]
- Equipment maintenance records: [Most recent]

**IV. Preliminary Conclusion**
- Possible Causes: [List 1-3 most likely causes]
- Temporary Measures: [Taken/Planned]
- Deviation Investigation Required: Yes/No
2.3 Phase 3: Deep Investigation (2-24 hours)
Root Cause Analysis Methods (RCA)

5 Whys diagram showing step-by-step analysis of ISO 5 particulate exceedance, tracing from visible problem to root cause of gowning room lighting failure
5 Whys Method Application Example
Problem: ISO 5 area particulate concentration exceedance

Why 1: Why exceedance?
    → Monitoring shows 0.5μm particles at 12/m³ (limit ≤3.52)

Why 2: Why did particles increase?
    → Correlated with adjacent Grade A area particle changes

Why 3: Why did Grade A area particles increase?
    → Personnel entry/exit operations during monitoring period

Why 4: Why did operations cause particle increase?
    → Personnel did not strictly follow gowning procedures

Why 5: Why were gowning procedures not strictly followed?
    → Gowning room lighting system failure, affecting personnel operation
Fishbone Diagram (Ishikawa) Classification
Fishbone diagram showing four main branches: Equipment Issues (sensor failure, calibration), Personnel Factors (training, fatigue), Environmental Factors (temperature, humidity), and Method Issues (SOP, procedures)
For detailed CAPA procedures, see our cleanroom qualification and validation SOP template.
2.4 Phase 4: Corrective & Preventive Actions (24 hours - 7 days)
CAPA Framework Application
Corrective Action - Immediate Measures
- Repair lighting system
- Retrain relevant personnel
- Add temporary lighting equipment
Preventive Action - Long-term Measures
- Update gowning area equipment maintenance schedule
- Add lighting failure emergency procedure
- Regular inspection of all critical area equipment
Verification
- Continuous monitoring for 7 days, confirm no similar alerts
- On-site audit to confirm SOP execution
- Revalidate equipment performance
3. Data-Driven: Extracting Value from Alerts
3.1 Alert Trend Analysis Dashboard
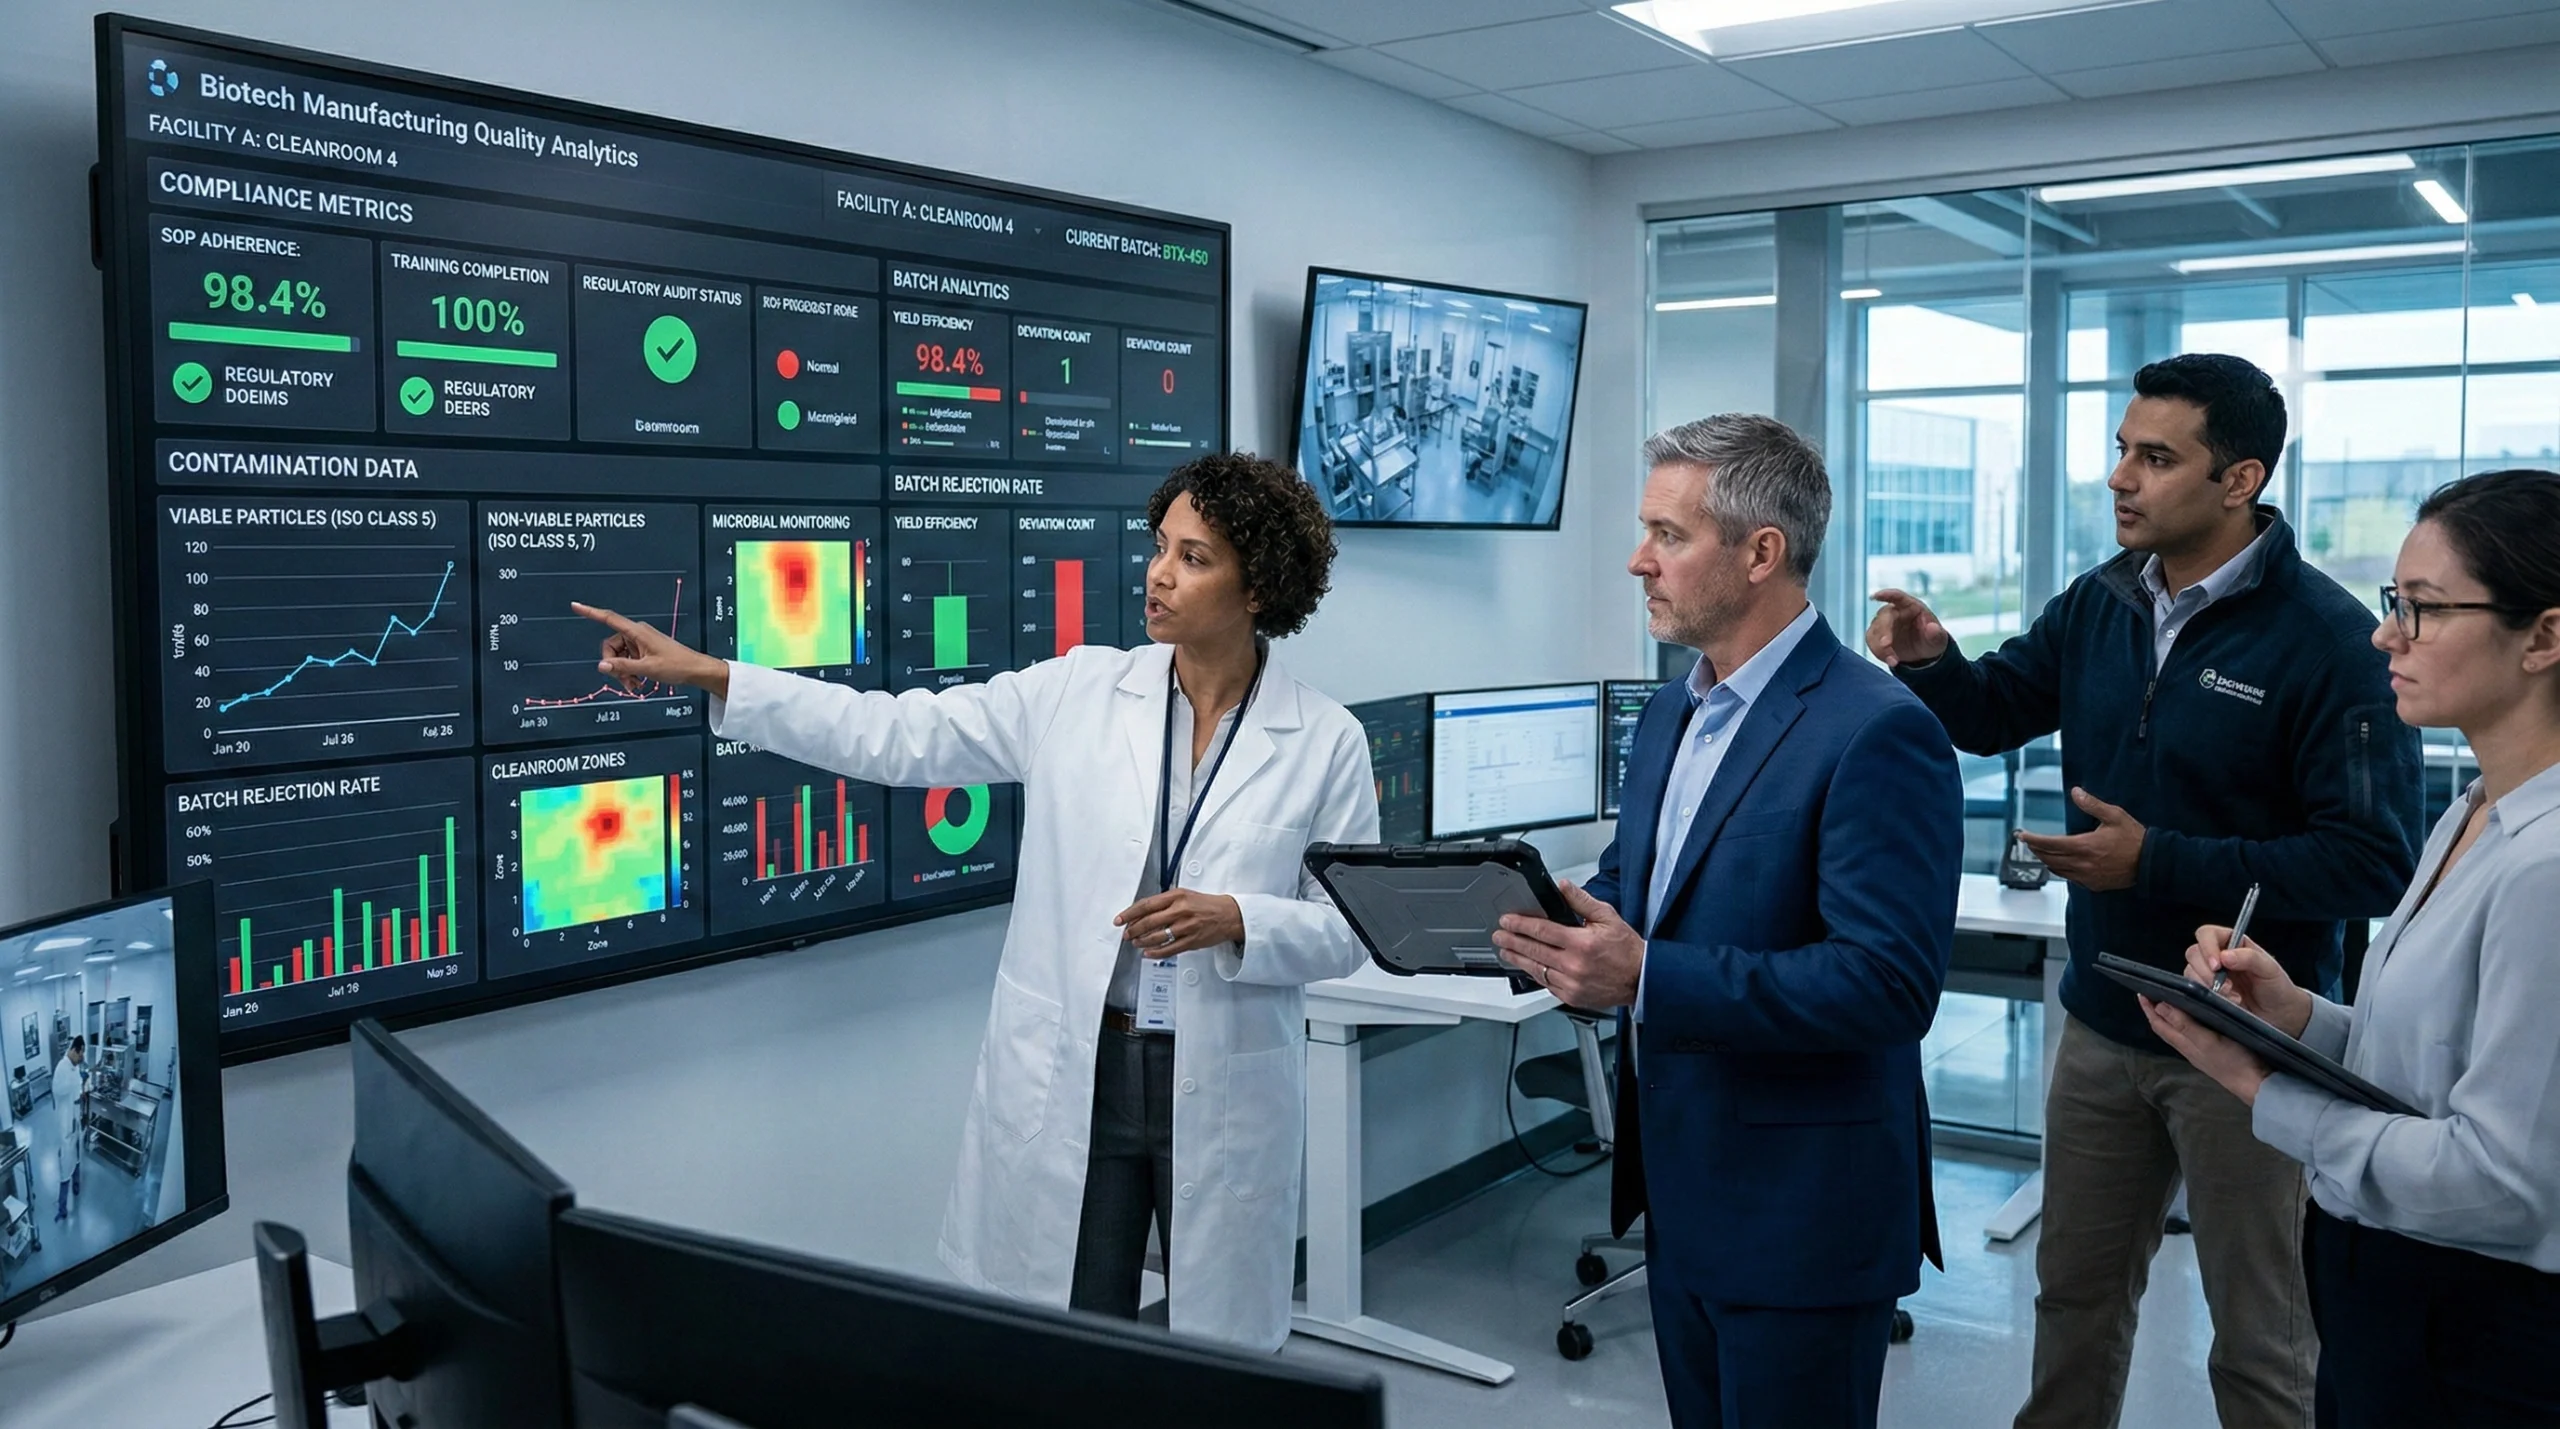
Dashboard visualization displaying alert response time (15 min), investigation completion rate (95%), recurrent alert rate (5%), root cause identification rate (80%), and CAPA effectiveness (90%) with trend lines
| Metrik | Calculation Method | Hedef |
|---|---|---|
| Alert Response Time | Time from alert to acknowledgment | ≤15 minutes |
| Preliminary Investigation Completion Rate | Investigations completed within 2 hours | ≥95% |
| Recurrent Alert Rate | Same location alerts within 30 days | ≤5% |
| Root Cause Identification Rate | True cause identified alerts | ≥80% |
| CAPA Effectiveness | No recurrence after 6 months | ≥90% |
Bizim risk-based environmental monitoring SOP provides additional guidance on setting appropriate KPI targets based on your facility's risk profile.
3.2 Predictive Maintenance: From Reactive to Proactive
Alert Pattern Recognition
Pattern 1: Seasonal Alerts
→ Humidity alerts increase in March/September
→ Preventive measure: Early inspection of dehumidification systems
Pattern 2: Equipment Aging Trend
→ False positive rate of specific sensors increases monthly
→ Preventive measure: Schedule periodic calibration/replacement
Pattern 3: Operational Process Correlation
→ Alerts increase during batch production periods
→ Preventive measure: Optimize production scheduling, avoid peaks
This pattern-based approach to contamination prevention transforms your alert system from a reactive tool into a predictive asset.
4. Common Mistakes and Solutions
Mistake 1: Treating All Alerts as "False Positives"
Consequences
- Ignoring real risks
- Delayed discovery of systemic issues
- Regulatory audit deficiencies
Correct Approach
- Establish false positive assessment criteria
- Record justification for each "false positive" determination
- Periodically review false positive alerts
Mistake 2: Focusing Only on "Exceedance," Ignoring "Trends"

Line graph comparing trend-based early warning system (showing gradual approach to limit) vs threshold-based system (showing sudden exceedance), demonstrating value of trend monitoring
Consequences
- Missing early warning opportunities
- Sudden exceedances causing production disruption
Correct Approach
- Set trend alerts (e.g., 3 consecutive readings above 80% of limit)
- Establish "warning zone" concept
- Early intervention to prevent exceedance
Mistake 3: CAPA Measures Only Address Symptoms, Not Root Causes
Consequences
- Recurring similar alerts
- Wasted resources
- Low team morale
Correct Approach
- Consistently apply 5 Whys method
- Address system issues, not individual issues
- Establish CAPA effectiveness verification mechanism
Mistake 4: Incomplete Documentation
Consequences
- Regulatory inspection findings
- Inability to trace history
- Knowledge transfer gaps
Correct Approach
- Use standardized templates
- Ensure every investigation has complete records
- Establish electronic archive system
For compliance with EU GMP Annex 1 cleanroom SOP documentation, ensure all alert management activities are properly documented and archived.
5. Team Training and Capability Building
5.1 Tiered Training Plan
Basic Training (All Personnel)
- Alert types and meanings
- Basic response procedures
- Recording requirements
Intermediate Training (QA/Environmental Monitoring Specialists)
- Preliminary investigation methods
- Data collection techniques
- Communication and coordination
Advanced Training (QA Managers/Quality Directors)
- Kök neden analizi
- CAPA development and verification
- Trend analysis and prediction
5.2 Regular Drills
Quarterly Drill Scenarios
Scenario 1: Grade A area particulate exceedance
Scenario 2: Differential pressure anomaly for 3 consecutive days
Scenario 3: Microbial test result exceedance
Scenario 4: System-wide alerts
6. Digital Tool Recommendations
6.1 Alert Management System Feature Checklist
Real-time alert push (email/SMS/APP)
Automated preliminary investigation templates
Trend analysis and prediction
CAPA tracking management
Report generation and export
Mobile access
Integration with LIMS/MES systems
Electronic signature compliance
Audit trail functionality
Multi-language support
6.2 MIDPOSI Solution Advantages

MIDPOSI alert management system interface showing real-time alerts, response tracking, CAPA management, and analytics dashboard in a unified view
MIDPOSI provides:
- Pre-loaded industry standard templates - Ready-to-use SOPs
- Intelligent alert classification - AI-assisted automatic grading
- Mobile application - Response anytime, anywhere
- Uyumluluk güvencesi - FDA 21 CFR Part 11 compliant
FAQ: Cleanroom MOPS Alert Management
Q1: What are best practices for cleanroom MOPS alert response?
A: Establish a three-tier response system: Critical alerts acknowledged within 15 minutes, Warning alerts responded to within 60 minutes, and Informational alerts handled within 24 hours. Ensure every alert has complete investigation records, root cause analysis, and CAPA measures. Regularly review alert data to identify patterns and optimize preventive measures.
Q2: How do I distinguish between real alerts and false positives?
A: Establish false positive assessment criteria: check sensor status, calibration records, environmental conditions, and operational activities. Use statistical analysis (e.g., 3σ principle) to identify outliers. Document justification for each false positive determination and periodically review to improve accuracy.
Q3: What are GMP Annex 1 compliance requirements for MOPS alert management?
A: GMP Annex 1 requires: establishing environmental monitoring plans, defining alert limits, developing response SOPs, recording all exceedance events, conducting trend analysis, implementing CAPA measures, and regularly reviewing monitoring systems. Ensure all activities are traceable and auditable.
Q4: How can I reduce recurring MOPS alerts?
A: Deeply analyze historical data to identify repetitive patterns. Use 5 Whys or fishbone diagrams to find root causes, not surface causes. Implement systematic CAPA measures, not temporary patches. Establish preventive maintenance programs to proactively identify potential issues.
Q5: How can MOPS alert data be used for continuous improvement?
A: Establish KPI dashboards to track response time, investigation completion rate, recurrent alert rate, and other metrics. Regularly hold quality review meetings to analyze trends and patterns. Update lessons learned into SOPs, creating a knowledge base. Predictive analysis to proactively intervene in high-risk points.
Internal Resource Links
- Complete Contamination Control Strategy
- Particle vs Microbial Contamination Differences
- Sources of Cleanroom Contamination
- Cleanroom MOPS Implementation Guide
- Cleanroom Qualification & Validation SOP Template
- Risk-Based Environmental Monitoring SOP
- Contamination Prevention Strategies
- EU GMP Annex 1 Cleanroom SOP Documentation