What Environmental Monitoring Location Selection Really Means
In GMP cleanrooms, environmental monitoring is not just about placing settle plates or active air samplers at equal distances across a room. The real objective is to identify the locations where contamination is most likely to appear first, spread fastest, or create the highest product risk.
That means monitoring location design must consider process exposure, human intervention, transfer events, equipment surfaces, airflow disruption, room classification, and historical deviations. A room may be visually clean and still contain hidden risk zones if operators repeatedly reach into the same location, if carts disturb unidirectional airflow, or if material transfer steps create momentary contamination spikes.
EM location selection should answer:
- Where is contamination most likely to enter?
- Where can particles or microbes accumulate?
- Which points are closest to exposed product or critical surfaces?
- Where will an excursion matter most from a GMP perspective?
Typical input data:
- Airflow visualization / smoke studies
- Intervention mapping
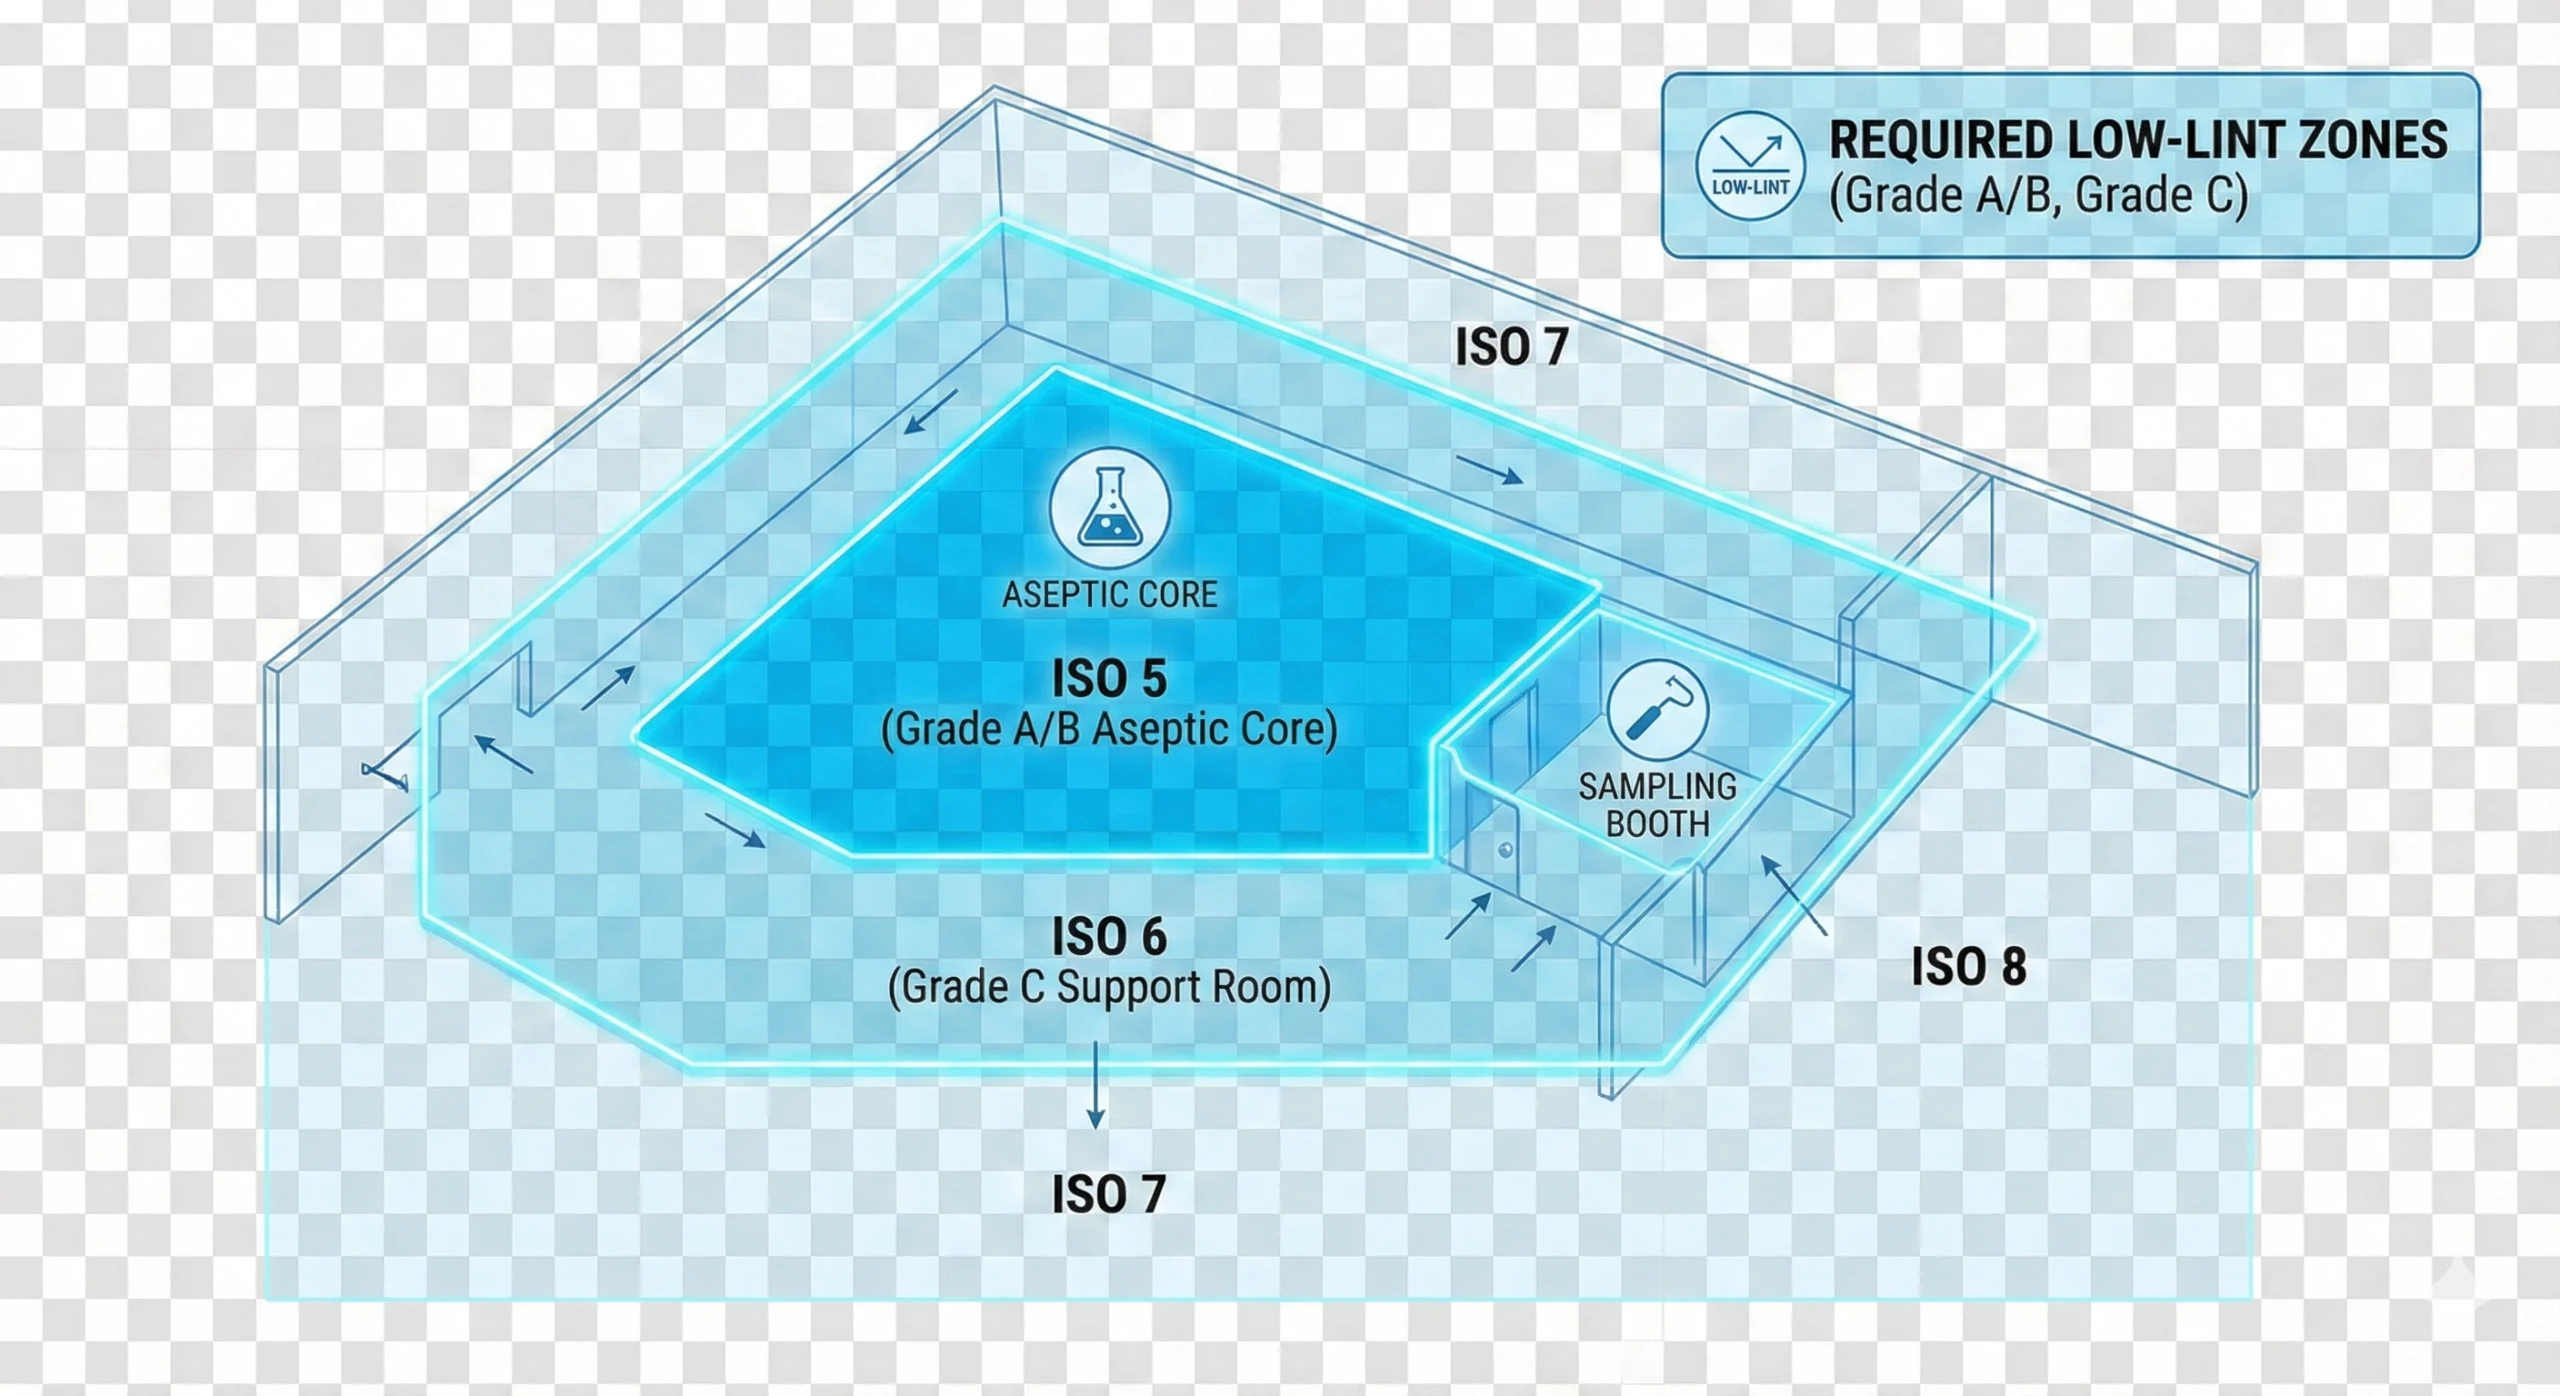
- Room classification and zoning
- Historical EM trend data
- Cleaning and disinfection workflow review
Why Risk-Based Placement Matters in GMP Cleanrooms
A GMP cleanroom is a controlled system, but not a static one. Operators move, materials transfer, equipment heats up, doors open, and surfaces are repeatedly touched. The highest-risk zones are often created by workflow rather than architecture.
A risk-based EM strategy improves deviation detection, strengthens trend analysis, and makes your monitoring program easier to defend during audits. It also prevents the common failure of over-monitoring low-value points while under-monitoring locations near real process exposure.
Risk-based placement becomes especially important when:
- There are frequent operator interventions near exposed product.
- Transfer points connect rooms with different cleanliness conditions.
- Equipment creates local turbulence or shadow zones.
- Historical EM excursions cluster around specific workflows.
- Cleaning coverage is inconsistent near corners, wheels, or supports.
For teams refining a full qualification strategy, this topic should be connected with IQ/OQ/PQ qualification planning, because monitoring location selection becomes more defensible when it is tied to documented airflow verification, intervention studies, and operational qualification logic.
High-Risk Environmental Monitoring Locations to Evaluate First
The exact monitoring map will vary by process and cleanroom grade, but the following areas usually deserve first-pass evaluation.
| Location Type | Why It Matters | Common Risk Signal | Monitoring Relevance |
|---|---|---|---|
| Near exposed product path | Direct contamination impact to product or critical surface | Intervention, open handling, aseptic exposure | Highest priority |
| Operator intervention points | Hands, sleeves, body motion disturb airflow and shed contamination | Repeated reach-in actions or manual adjustments | Very high priority |
| Material transfer / pass-through zones | Transition between cleanliness states can introduce particles and microbes | Door openings, cart passage, packaging removal | High priority |
| Equipment interface zones | Heat, vibration, or geometry can create airflow dead spots | Shadow areas, inaccessible surfaces, repeated contact | High priority |
| Floor areas under traffic routes | Particle transport, wheel contamination, poor wetting coverage | Recurring surface plate excursions | Medium to high priority |
| Room corners / hard-to-clean edges | Cleaning blind spots may trap residues or microbes | Trend spikes after cleaning or shutdown | Medium priority |
| Return airflow influence zones | Can indicate migration or collection behavior | Unexpected directional contamination pattern | Case dependent |
How to Build an Environmental Monitoring Location Map
A robust EM map is usually built in layers rather than in one step. Start with process understanding, then overlay airflow, interventions, transfer routes, and cleaning boundaries. The best teams treat EM location planning as a cross-functional exercise involving QA, microbiology, operations, engineering, and contamination control.
Recommended step-by-step approach
1. Define the critical process and exposed-risk zones
Mark where product, components, tools, or critical surfaces are exposed. This establishes the locations where contamination would have the greatest GMP consequence.
2. Review airflow behavior and smoke study results
Identify airflow paths, turbulence areas, recirculation zones, and shadow points. Monitoring should reflect real air behavior, not just equipment footprint.
3. Map operator interventions and transfer motions
Repeated manual activities often explain excursion patterns better than room layout alone.
4. Align with cleaning and sanitization boundaries
Confirm that locations with elevated contamination risk are also visible in the cleaning program and SOP structure. This should tie back to your cleanroom cleaning and sanitization SOP.
5. Use historical trend data to refine the map
Existing excursions, action-level events, or recurring “near misses” often show you where to monitor more intelligently.
Environmental Monitoring Location Decision Matrix
A simple scoring model helps teams prioritize where to place active air sampling, settle plates, contact plates, or surface swabs. You can adapt the matrix below to your site protocol.
| Scoring Factor | Description | Low Score | High Score |
|---|---|---|---|
| Product proximity | How close the point is to exposed product or critical surface | Remote from process | Directly adjacent |
| Intervention frequency | How often personnel interact near the point | Rare | Frequent / repetitive |
| Airflow disturbance | Likelihood of turbulence, shadowing, or contamination migration | Stable airflow | Known disturbance zone |
| Transfer exposure | Whether materials or tools cross contamination boundaries here | No transfer relevance | High transfer activity |
| Historical trend risk | Previous alerts, excursions, or suspicious pattern | Clean history | Repeated signal |
| Cleaning difficulty | Potential for residue, blind spots, or inconsistent mop coverage | Easy to access | Hard-to-clean geometry |
This matrix also naturally connects to audit readiness, because a documented rationale for monitoring point selection is easier to defend than a map based only on legacy habit.
Common Mistakes When Choosing EM Locations
1. Using room symmetry instead of contamination risk
Equal spacing may look neat, but GMP monitoring is not an interior design exercise. It is a risk-detection system.
2. Ignoring floor and transfer pathways
Floor-associated contamination can be highly relevant, especially where wheels, bins, buckets, or material movement repeatedly intersect with controlled pathways. This is one reason cleaning tool selection and traceability matter.
3. Separating EM from cleaning validation
If contamination is repeatedly detected near the same zone, the investigation should not stop at sampling frequency. It should also question mop design, saturation control, operator technique, and SOP execution.
4. Failing to connect EM findings with batch and documentation controls
A meaningful excursion investigation often requires strong batch traceability for cleanroom consumables, especially when surface cleaning tools or sterile consumables may contribute to variation.
How Cleaning Tools Influence Environmental Monitoring Outcomes
Environmental monitoring data does not exist in isolation. A location may trend poorly because the contamination source is real, but it may also trend poorly because cleaning coverage is inconsistent, the wrong mop material is used for the zone, or the tool itself sheds particles or fails to retain contamination effectively.
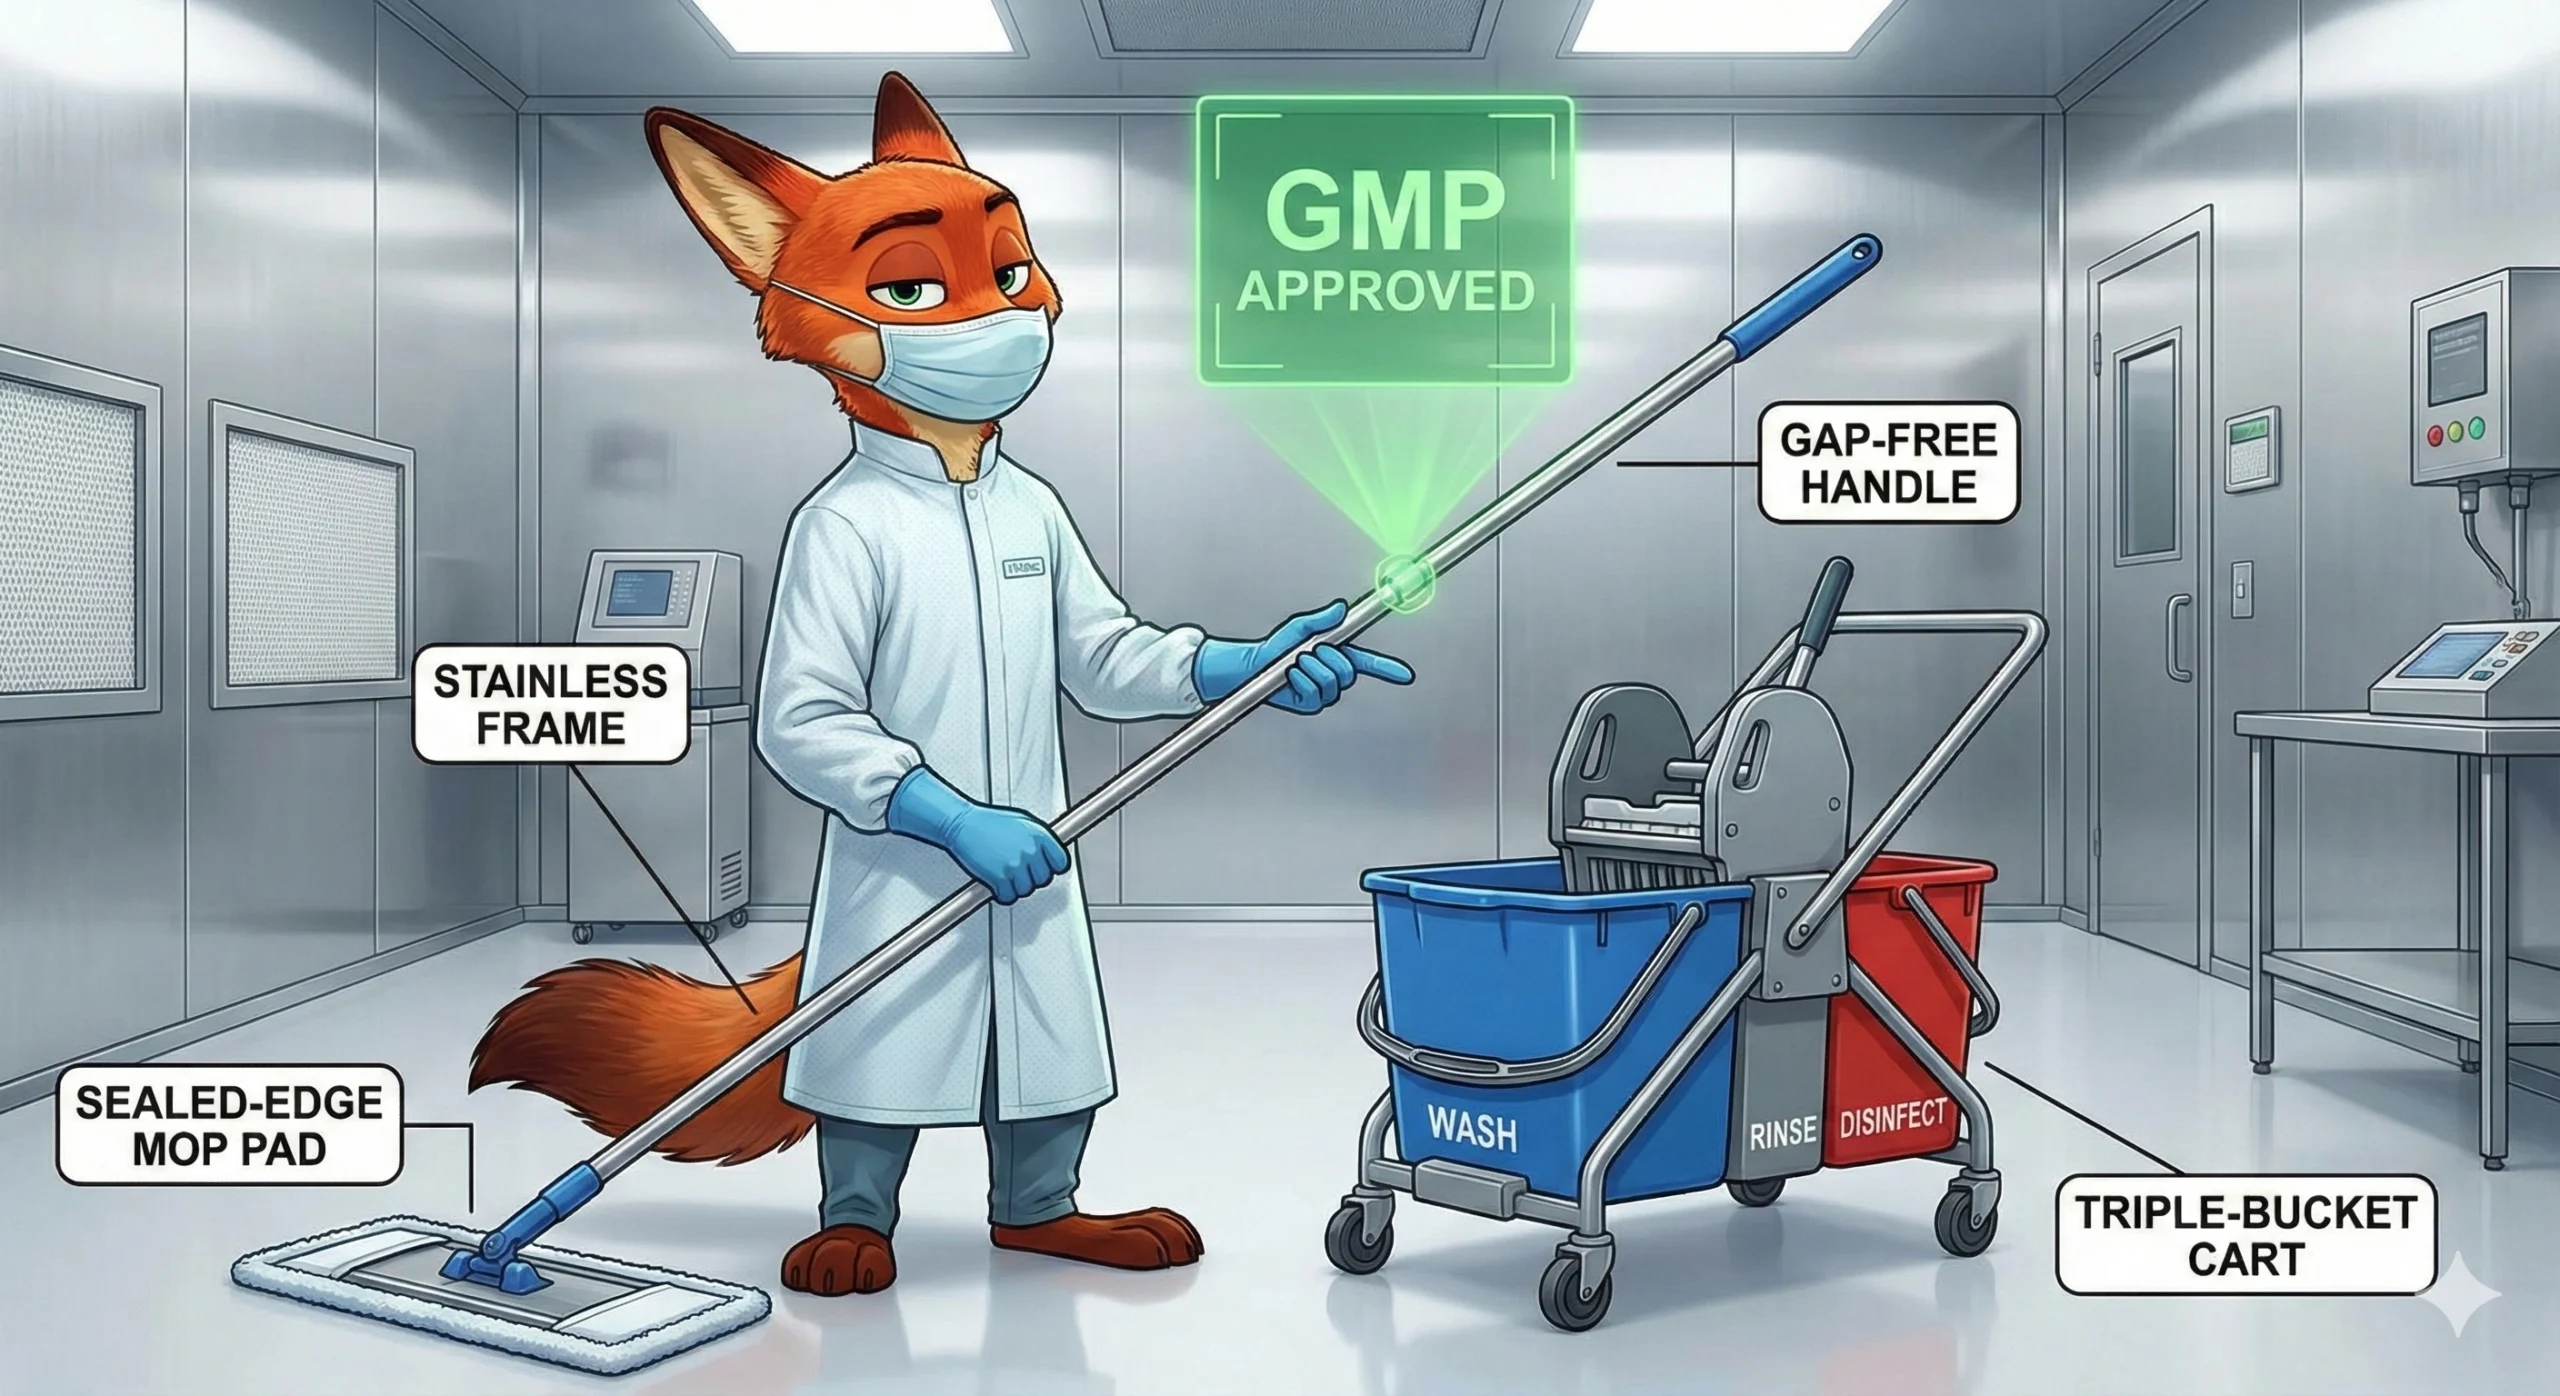
That is why environmental monitoring strategy should be reviewed together with mop head construction, edge sealing, saturation control, bucket method, sterilization route, and consumable traceability. For facilities with repeated excursions near floors, transfer edges, or difficult geometries, cleaning system optimization can be as important as monitoring intensity.
Review your mop system when:
- Surface counts trend high in the same cleaned area
- Coverage is inconsistent around corners or under equipment
- Operators improvise cleaning motion due to poor ergonomics
- Consumable documentation is incomplete during investigations
Review your EM map when:
- Excursions appear disconnected from current sample points
- Interventions changed but the monitoring map did not
- New equipment changed airflow patterns
- Room classification stayed the same but process risk increased
Need Help Matching Monitoring Risk to Cleaning System Design?
Midposi supports buyers and technical teams that need cleanroom mops aligned with contamination control strategy, documentation expectations, and controlled-environment cleaning workflows.
- Cleanroom mop options for different risk zones
- Support for ISO / GMP-oriented cleaning workflows
- Documentation-oriented approach for QA and procurement review
Recommended Internal Links for This Article
Based on your uploaded content map, this article should sit inside the Environmental Monitoring cluster and connect naturally to qualification, audit, traceability, SOP, standards, and gowning topics.:contentReference[oaicite:4]{index=4} :contentReference[oaicite:5]{index=5}
- Cleanroom IQ OQ PQ Qualification Explained — link when discussing verification logic and documented rationale.
- How to Prepare for a GMP Cleanroom Audit — link when discussing defensible monitoring maps and audit questions.
- Batch Traceability for Cleanroom Consumables — link when discussing investigations and excursion review.
- Cleanroom Cleaning and Sanitization SOP: Complete Guide — link when discussing floor and surface cleaning controls.
- Cleanroom Gowning Procedures: Annex 1 Compliance Guide — link when discussing personnel contamination vectors.
- ISO 14644 Classification Explained — link when discussing room classification and zone logic.
Suggested anchor text mix: “environmental monitoring map”, “GMP cleanroom audit readiness”, “cleanroom batch traceability”, “cleanroom cleaning SOP”, “ISO 14644 classification”, “Annex 1 gowning procedures”.
よくある質問
How do you choose environmental monitoring locations in a GMP cleanroom?
Start with risk. Prioritize locations near exposed product, operator interventions, transfer points, and airflow disruption zones. Then validate the map against workflow, historical trend data, and cleaning boundaries.
Should EM locations be evenly distributed across the room?
Not necessarily. Even spacing may miss the highest-risk points. Risk-based placement is usually more meaningful and more defensible during GMP review.
What data should be used to justify EM points?
Use airflow studies, intervention mapping, process exposure analysis, historical EM results, equipment layout, room zoning, and cleaning workflow review.
Do floor cleaning tools affect environmental monitoring outcomes?
Yes. Poor cleaning coverage, inconsistent saturation, unsuitable mop materials, or incomplete consumable control can all influence recurring surface contamination trends.