Cleanroom Mop Total Cost of Ownership — A Procurement Framework for GMP Facilities
A procurement framework that moves beyond cleanroom mop unit price. Covers six TCO dimensions — change frequency, validation, labor, non-compliance risk, and inventory — so GMP procurement managers can build defensible business cases instead of defaulting to the lowest unit cost.

Quick Answer: What Is the True Cost of a Cleanroom Mop Program?
The total cost of ownership (TCO) of a cleanroom mop program is the sum of six cost dimensions that span the entire lifecycle of each mop or mop head used in your facility. The visible cost — the unit price on a purchase order — is typically only a fraction of the total financial commitment.
A complete cleanroom mop TCO includes:
The TCO Iceberg: Visible vs Hidden Costs
| ਪਰਤ | Cost Dimension | Visibility in Standard Procurement |
|---|---|---|
| Visible | 1. Unit Acquisition Cost | Captured on every purchase order |
| Hidden | 2. Change Frequency & ਸੇਵਾ ਜੀਵਨ | Rarely tracked unless documented by SOP |
| 3. Validation & Documentation Cost | Typically separated from procurement budget | |
| 4. Labor & Retraining Cost | Often invisible in mop-specific analysis | |
| 5. Non-Compliance & Contamination Event Cost | Charged to quality, not procurement budget | |
| 6. Inventory & Logistics Cost | Spread across warehousing and supply chain |
Note: The specific distribution of costs between visible and hidden layers depends on facility-specific parameters including cleanroom grade, cleaning frequency, SOP requirements, and procurement volume. No single TCO number applies universally across all GMP environments.
Why Unit Price Is the Wrong Metric for Cleanroom Mops
Unit-price-only procurement is one of the most persistent inefficiencies in GMP consumable management. When a procurement team compares cleanroom mops purely on the price-per-unit line item, the comparison systematically favors products with shorter service life — exactly the products that may drive higher total costs over a full operating year.
The core problem is that a ਕਲੀਨਰੂਮ ਮੋਪ is not a one-use consumable for which unit price is the full story. It is a cleaning-tool component whose total cost is shaped by how many times it is used, how much validation overhead it creates, how frequently operators must stop to change it, and what happens when it fails to perform as expected.
An Illustrative Comparison: Unit Price vs Total Cost
| ਪੈਰਾਮੀਟਰ | Option A: Lower Unit Price | Option B: Higher Unit Price, Longer Service Life |
|---|---|---|
| Unit price per mop head | $X | ~3–5x $X |
| Typical service life (uses per mop) | 1 use (disposable) | 50–200+ uses (reusable, depending on material and protocol) |
| Mop heads needed per 1,000 cleaning events | 1,000 | 5–20 |
| Per-use acquisition cost | $X per use | ~$X × 0.01–0.06 per use |
| Validation batches per year | One per shipment (multiple per year) | One per production batch (fewer batches over same usage) |
| Changeover events per shift | Every mop use (frequent) | Every 50–200 mop uses (infrequent) |
When the per-use cost of acquisition, the validation overhead per batch, and the labor cost of frequent changeover are added together, the lower-unit-price option may carry a total cost that is significantly higher than the alternative — especially in high-frequency cleaning environments.
The practical implication for procurement: a bid comparison that only compares column one of the table above (unit price) will systematically underreport the true cost difference. Understanding the full cleanroom mop lifecycle cost requires evaluating each mop option on a cost-per-cleaning-event basis that includes all six dimensions described in the framework below.
For a broader perspective on evaluating mop systems beyond the unit-price lens, see our ਕਲੀਨਰੂਮ ਮੋਪ ਸਿਸਟਮ ਦੀ ਸੰਖੇਪ ਜਾਣਕਾਰੀ ਅਤੇ how to choose a cleanroom mop system ਗਾਈਡ
The 6-Dimension TCO Framework
The six dimensions below define a complete cost model for any cleanroom mop or mop-head SKU. Together they capture the full lifecycle expense — from initial purchase through disposal or end-of-life — that should inform procurement decisions in GMP-regulated environments.
| # | Dimension | Cost Driver | Calculation Approach |
|---|---|---|---|
| 1 | Unit Acquisition Cost | Price per mop head or pad | Quoted unit price × annual quantity |
| 2 | Change Frequency & ਸੇਵਾ ਜੀਵਨ | Number of uses before replacement | Annual cleaning events ÷ uses per mop × unit cost |
| 3 | ਪ੍ਰਮਾਣਿਕਤਾ & ਦਸਤਾਵੇਜ਼ੀਕਰਨ | Per-batch verification and document release | Validation cost/batch × number of batches/year |
| 4 | ਲੇਬਰ & Retraining | Operator time for changeover + retraining events | Changeover time × operator hourly rate + retraining cost/event |
| 5 | Non-Compliance & Contamination Events | Investigation, batch rejection, audit finding cost | Event cost × estimated probability/year |
| 6 | ਵਸਤੂ ਸੂਚੀ & Logistics | Storage, MOQ, freight, shelf-life management | Carrying cost + freight × shipments/year + expired product write-off |

Dimension 1: Unit Acquisition Cost
The visible cost: the price per mop head or mop pad as quoted on a purchase order. This is the dimension that procurement teams are most familiar with, and the one that dominates bid comparison sheets. Unit acquisition cost is straightforward to calculate: quoted price multiplied by the anticipated annual order quantity.
However, unit acquisition cost alone provides almost no information about total program cost because it does not account for how long each mop lasts, how many validation cycles it triggers, or how much operator time it consumes. It is the starting point of TCO analysis, not the conclusion.
In a TCO model, unit acquisition cost should be expressed as cost per cleaning event rather than cost per unit. This requires combining unit cost with the service-life dimension below.
Dimension 2: Change Frequency and Service Life
Service life — the number of cleaning events one mop head can deliver before it is retired — is the single largest multiplier in any cleanroom mop TCO calculation.
A disposable mop head is typically used for one cleaning event and then discarded. A reusable mop head, depending on material construction (polyester, microfiber, or blended), weight specification (40g, 55g, 65g), and laundering protocol, may deliver 50 to 200+ uses before degradation in particle-shedding performance or physical integrity triggers replacement.
This difference means that a reusable mop with a unit price several times higher than a disposable may still produce a per-use cost that is a fraction of the disposable alternative. A facility running 2,000 cleaning events per month will consume approximately 2,000 disposable mop heads in that period; the same facility using a reusable mop rated for 100 uses may require only 20 mop heads over the same volume of cleaning.
The change frequency dimension also includes the monetary value of operator time spent stopping to change mop heads. In high-frequency cleanroom cleaning protocols, this time can become a meaningful cost driver over a full operating year.
Dimension 3: Validation and Documentation Cost
Every batch of cleanroom mops entering a GMP facility must typically be verified against specifications, documented in the quality management system, and released for use. The cost of this validation cycle — quality assurance personnel time, documentation review, incoming inspection, and any third-party testing — is a function of the number of batches received, not the number of units in each batch.
This creates a cost asymmetry between disposable and reusable mop programs:
- Disposable mops: Every shipment represents a new batch requiring validation. Higher consumption volume means more frequent shipments, more validation cycles, and more documentation overhead per year.
- Reusable mops: A single production batch may cover several months of use. The validation cost per batch is spread over a larger number of cleaning events, reducing the per-use validation overhead.
Validation overhead is especially significant for sterile cleanroom mops, where each batch may require sterility assurance documentation, Certificate of Analysis (COA) verification, and potentially irradiation or sterilization cycle records. For a detailed breakdown of what validation documents should be expected, see the cleanroom mop validation documents checklist.
Dimension 4: Labor and Retraining Cost
Labor cost in the TCO framework covers two categories: changeover labor and retraining labor.
Changeover labor is the operator time required to remove a used mop head or pad and attach a new one. While each individual changeover may take only 30 to 90 seconds, in a large facility running hundreds of cleaning events per shift, the cumulative time across a year can represent a non-trivial operational cost. A mop program with frequent single-use changeover requires far more operator intervention than one based on a reusable mop that remains in service for an entire shift or zone-cleaning procedure.
Retraining labor is incurred when a facility switches mop types, suppliers, or cleaning protocols. Each transition requires SOP revision, operator training sessions, and a period of supervised implementation. If a lower-unit-price product also has a higher supplier turnover rate or inconsistent availability, the retraining cycles may occur more frequently than anticipated.
Both categories should be estimated in hours and multiplied by the fully loaded operator cost (not base salary), including benefits, overhead, and supervisory time.
Dimension 5: Non-Compliance and Contamination Event Cost
This is the dimension that procurement teams most frequently omit — and the one that can dominate the TCO calculation if a contamination event occurs.
The cost of a single contamination investigation linked to cleaning tools may include:
- Environmental monitoring (EM) excursion investigation time
- Root cause analysis and CAPA documentation
- Product batch hold, rejection, or recall (in pharmaceutical manufacturing)
- Regulatory audit finding response and remediation
- Production downtime during investigation
- Reputational and regulatory standing impact
While the probability of a contamination event attributable to a mop is low in a well-managed program, the financial consequence of a single event can be multiples of the annual mop procurement budget. A mop product that carries a measurably lower particle-shedding profile, better lot-to-lot consistency, or more robust sterile packaging integrity may reduce both the probability and the potential severity of such an event.
In a TCO model, this dimension is typically handled as a risk-adjusted cost: estimated event cost multiplied by estimated annual probability, which produces a dollar value that can be included in the total cost comparison — recognizing that these estimates carry uncertainty and depend heavily on facility-specific conditions.
Dimension 6: Inventory and Logistics Cost
Inventory and logistics costs include storage space, minimum order quantities (MOQ), freight charges per shipment, and shelf-life management — particularly for sterile products with defined expiry dates.
Key cost drivers in this dimension:
- Storage footprint: A high-consumption disposable mop program may require significant warehouse or cleanroom-adjacent storage space. A reusable program with lower replenishment frequency reduces the space requirement.
- Minimum order quantities: If a supplier requires large MOQs to achieve a low unit price, the buyer carries the working-capital cost of holding excess inventory.
- Freight and handling: More frequent shipments mean more freight events per year. International shipments may carry additional customs, duties, and inspection fees.
- Shelf-life expiry (sterile products): Gamma-sterilized cleanroom mops carry a sterility shelf life. Products that expire before use represent a direct write-off that should be factored into the per-use cost. A higher-quality product with a validated longer shelf life may reduce this form of waste.
TCO Comparison Scenarios — Disposable vs Reusable, Sterile vs Non-Sterile
The following three scenarios illustrate how the six-dimension TCO framework produces different conclusions depending on facility grade, sterility requirement, and cleaning frequency. These are illustrative scenarios based on typical GMP facility parameters; actual costs must be modeled using your facility’s specific usage volumes, labor rates, and protocol requirements.
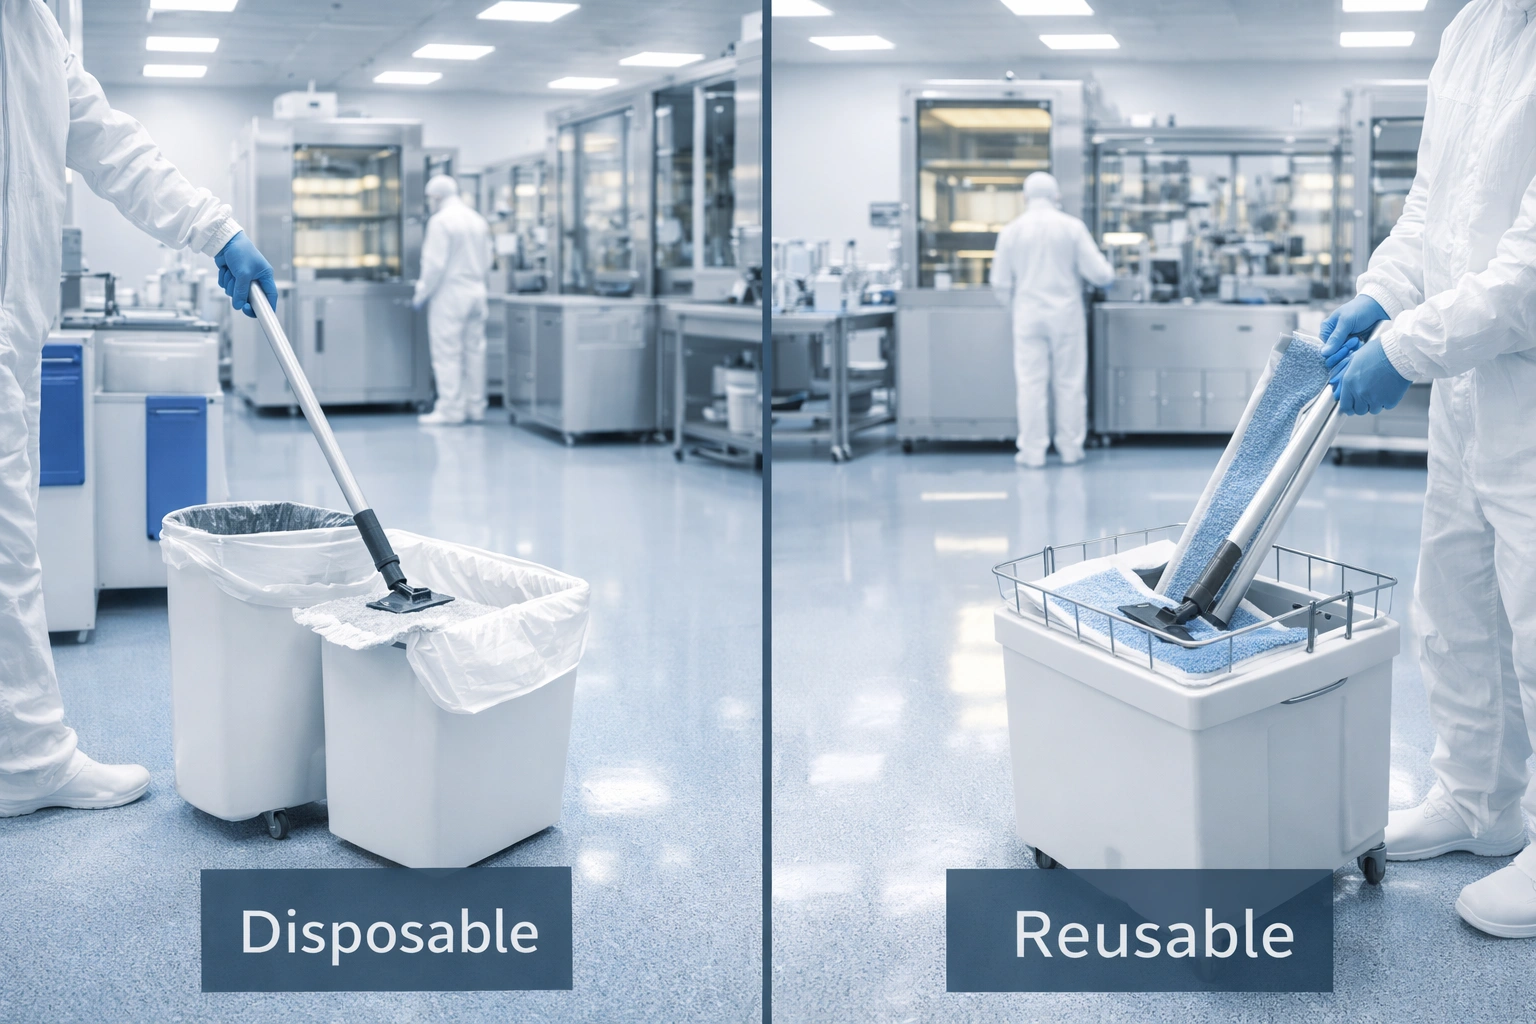
For a broader discussion of the operational trade-offs, refer to our disposable vs reusable cleanroom mop decision guide.
Scenario 1: Disposable Non-Sterile vs Reusable Non-Sterile (Grade C/D)
| TCO Dimension | Disposable Non-Sterile | Reusable Non-Sterile | ਨੋਟਸ |
|---|---|---|---|
| 1. Unit Acquisition | Lower per-unit price | Higher per-unit price (~3–5x) | Reusable higher at purchase order level |
| 2. Change Frequency | 1 use / mop head | 50–200 uses / mop head | Reusable per-use cost is a fraction of disposable |
| 3. Validation | One validation cycle per shipment; more shipments/year | One validation cycle per batch; fewer batches/year | Validation cost per cleaning event is typically lower for reusable |
| 4. Labor | Changeover at every use; high cumulative time | Changeover every 50–200 uses; low cumulative time | Disposable labor cost is typically higher at volume |
| 5. Non-Compliance | Depends on lot-to-lot quality consistency | Depends on laundering control and material degradation tracking | Both carry risk; root cause differs |
| 6. Inventory | High volume, frequent shipments, more storage | Lower volume, fewer shipments, less storage | Disposable carries higher logistics burden |
| Typical TCO Outcome | Higher total cost at moderate-to-high usage levels | Lower total cost when usage exceeds breakeven threshold | Breakeven depends on cleaning events/year |
Scenario 2: Disposable Sterile vs Reusable Sterile (Grade A/B)
| TCO Dimension | Disposable Sterile | Reusable Sterile | ਨੋਟਸ |
|---|---|---|---|
| 1. Unit Acquisition | Lower per-unit price | Higher per-unit price (sterile reusable typically carries premium) | Sterile packaging adds cost to both |
| 2. Change Frequency | 1 use / mop head; sterile packaging per unit | 50–200 uses / mop head; sterile validation per batch | Reusable spreads sterility validation over more uses |
| 3. Validation | Per-shipment sterility verification + COA per batch | Per-batch sterility verification spread over longer lifecycle | Grade A/B validation is more resource-intensive for both |
| 4. Labor | High changeover frequency; aseptic transfer per use | Low changeover; requires laundering/SIP protocol | Different labor profiles; reusable may require in-house sterilization |
| 5. Non-Compliance | Sterile integrity breach risk per individual package | Sterility maintenance risk during storage and reuse cycle | Grade A/B risk tolerance is near-zero; both require rigorous control |
| 6. Inventory | Shelf-life expiry risk on sterile products | Lower replenishment frequency; expiry risk on sterile batches | Sterile shelf-life management applies to both |
| Typical TCO Outcome | May be lower TCO at low usage, or where protocol mandates single-use | May be lower TCO at mid-to-high usage; regulatory requirements may override TCO | Regulatory compliance (Annex 1) may dictate the choice regardless of TCO |
Scenario 3: Lower-Unit-Price Option vs Higher-Unit-Price Option with Longer Service Life
| TCO Dimension | Low-Unit-Price Option | Higher-Unit-Price, Longer-Life Option | ਨੋਟਸ |
|---|---|---|---|
| 1. Unit Acquisition | Lower line-item price | Higher line-item price | Procurement-first comparison favors this |
| 2. Change Frequency | Shorter service life; more frequent replacement | Longer service life; fewer replacements needed | Longer-life option per-use cost may be lower |
| 3. Validation | More batches/year; more validation cycles | Fewer batches/year; fewer validation cycles | Validation economy scales with batch size |
| 4. Labor | More changeover events; potential for more retraining if supplier inconsistent | Fewer changeover events; supplier consistency reduces retraining | Supplier reliability is a multiplier on labor cost |
| 5. Non-Compliance | Quality consistency may vary; particle-shedding may degrade faster | More consistent quality profile; slower degradation | Quality is a TCO factor, not just a QA concern |
| 6. Inventory | Higher inventory volume; more freight events | Lower inventory volume; fewer freight events | Lower replenishment frequency improves cash flow |
| Typical TCO Outcome | May appear cheaper on unit price alone | May produce lower TCO once all six dimensions are calculated | Run the six-dimension model before concluding |
How to Build a Cleanroom Mop TCO Model
A practical TCO model does not need to be complex, but it must capture the key cost-driving variables for your facility. The steps below outline a model-building process that procurement teams can adapt to their specific GMP environments.
-
Define your usage parameters.
Determine the annual number of cleaning events per cleanroom grade, the number of mop heads consumed per event, and the current procurement volume. This establishes the baseline volume against which all per-use costs will be calculated.
-
Calculate per-use acquisition cost for each option.
For each mop product under consideration, divide the unit price by the expected number of uses (service life). This is the foundation cost per cleaning event. If multiple mop-weight specifications (40g, 55g, 65g) are under consideration, model each separately.
-
Add validation cost per cleaning event.
Estimate the fully loaded cost of one validation cycle (incoming inspection, COA review, documentation release) and divide it by the number of cleaning events covered by each batch. Include any third-party testing costs if applicable.
-
Add labor costs: changeover + retraining.
Calculate changeover labor as (changeover time per event × number of events per year × fully loaded hourly operator rate). Add an annualized retraining cost based on expected supplier or protocol change frequency.
-
Add risk-adjusted non-compliance cost.
Estimate the cost of one contamination event, multiplied by an estimated annual probability. This is inherently uncertain; sensitivity analysis (low/medium/high probability) is recommended rather than a single-point estimate.
-
Add inventory and logistics cost.
Include storage cost (space × cost per square meter or foot), freight cost per shipment × annual shipment count, and an estimated write-off for expired sterile products if applicable.
-
Compare scenarios side by side.
Sum all six dimensions for each option. Build at least two scenarios (e.g., baseline usage and high-usage growth scenario) to test whether the conclusion holds under different volume assumptions.
-
Update assumptions with actual data.
A TCO model is not a one-time exercise. As actual service life, changeover time, and validation costs are observed in operation, feed those numbers back into the model to refine future procurement decisions.
Common TCO Blind Spots in Cleanroom Mop Procurement
Even procurement teams that understand TCO in principle can fall into the following blind spots. Each blind spot represents a systematic underestimation of total cost that a six-dimension framework is designed to surface.
| Blind Spot | Consequence | TCO Fix |
|---|---|---|
| Comparing unit price without establishing service life assumptions | The lower-unit-price option may have a shorter service life, producing a higher per-use cost when volume is accounted for. | Request documented service-life data or validation from the supplier. Convert all unit prices to cost-per-cleaning-event before comparing. |
| Ignoring validation documentation cost per batch | A mop with lower unit cost but more frequent shipment batches may generate more validation overhead than the unit-price savings. | Calculate total validation cycles per year for each option. Include QA personnel time in the cost per cycle. |
| Not factoring sterile product shelf-life expiry | Ordering in bulk to achieve a lower unit price may lead to product expiry before use, creating a direct write-off that raises the effective per-unit cost. | Model shelf-life against consumption rate. Include expired-product write-off as a separate line in the TCO model. |
| Overlooking freight and MOQ impact on cash flow | A supplier requiring large MOQs to hit a low unit price ties up working capital in inventory. Frequent shipments drive freight costs higher. | Calculate the working-capital cost of carrying inventory (inventory value × cost of capital). Add annual freight cost as a separate line item. |
| Assuming “cheaper per unit” always wins without running the total cost calculation | Procurement defaults to the lowest-line-item bid, potentially selecting a higher-total-cost option without knowing it. | Run the full six-dimension TCO model for every significant mop procurement decision. Make TCO the decision metric, not unit price. |
| Treating mop cost as a facilities line item rather than a quality-system cost | The quality cost of a mop failure (contamination event, audit finding) is held in a different budget and is invisible to the procurement decision. | Bring quality and procurement stakeholders into the same TCO review. Model non-compliance cost as a shared, cross-functional metric. |
Beyond TCO — When Other Factors Override Cost
A TCO analysis is a powerful procurement tool, but it is not always the deciding factor. In GMP-regulated environments, non-cost considerations may override a TCO conclusion. Procurement teams should treat TCO as one input into a broader decision framework, not as a standalone mandate.
The following non-cost factors may supersede TCO in cleanroom mop procurement:
- Regulatory requirements. EU GMP Annex 1 and equivalent regulations explicitly mandate sterile cleaning tools for Grade A/ISO 5 aseptic processing zones. If the regulatory requirement specifies sterile, single-use, or double-bagged products, that requirement overrides any TCO comparison between sterile and non-sterile options. A lower-TCO non-sterile mop is not an option for a Grade A zone — regardless of how much it might theoretically save.
- Contamination risk tolerance. Different products, processes, and facilities carry different risk tolerances. A manufacturer of sterile injectable products has near-zero tolerance for any risk introduced by cleaning tools. A manufacturer of non-sterile oral solid dosage forms has a different risk profile. The acceptable risk level determines which mop option is viable, regardless of TCO ranking.
- Supplier qualification status. A supplier that is already qualified (audited, included in the approved supplier list, with validated materials on file) carries lower switching cost and lower risk than a new supplier, even if the new supplier offers a lower unit price. The cost and time required to audit, qualify, and validate a new supplier should be weighed against potential procurement savings.
- Existing SOP compatibility. If your facility’s cleaning SOPs, training materials, and validation protocols are built around a specific mop type, weight, or attachment system, switching to a different product may require SOP revision, revalidation, and operator retraining — costs that may not be fully captured in a standard TCO model.
- Supply chain resilience. A single-source supplier with the lowest TCO may represent a higher supply continuity risk than a dual-source strategy with slightly higher unit costs. In pharmaceutical manufacturing, a mop stockout that halts cleaning and production has a cost that dwarfs any annual savings from a lower unit price.
- Material and construction quality without price equivalence. Continuous filament polyester construction designed to minimize fiber breakage in Grade A/B zones, or microfiber with validated particle-retention characteristics, may carry a premium that is justified by performance requirements rather than TCO arithmetic alone.
For grade-specific regulatory guidance that may supersede TCO considerations, refer to our GMP ਕਲੀਨਰੂਮ ਮੋਪ ਗ੍ਰੇਡ ਚੋਣ ਗਾਈਡ.
ਅਕਸਰ ਪੁੱਛੇ ਜਾਂਦੇ ਸਵਾਲ
1. What is the total cost of ownership for cleanroom mops?
The total cost of ownership (TCO) for cleanroom mops is the sum of six cost dimensions: (1) unit acquisition cost, (2) change frequency and service life, (3) validation and documentation cost, (4) labor and retraining cost, (5) non-compliance and contamination event risk, and (6) inventory and logistics cost. These dimensions span the entire lifecycle of each mop head or pad used in a GMP facility, from initial purchase through disposal or end-of-life. A TCO framework typically reveals that unit purchase price is only one part of the total financial commitment — and often not the largest part when the six dimensions are calculated over a full operating year.
2. How do I compare disposable vs reusable cleanroom mop costs?
Start by converting both options to cost per cleaning event. For a disposable mop, divide the unit price by 1 (one use). For a reusable mop, divide the unit price by the validated number of uses (typically 50 to 200+, depending on material and protocol). Then add validation cost per batch (divided by the number of events each batch covers), labor cost for changeover (higher for disposable due to more frequent changes), and inventory/logistics cost (higher for disposable due to higher shipment frequency). Run this model at your facility’s actual annual cleaning-event volume. The breakeven point where reusable becomes the lower-TCO option depends on usage volume, service life, and your specific validation and labor overhead.
3. What hidden costs should I include in a cleanroom mop TCO analysis?
The hidden costs most commonly omitted from cleanroom mop procurement comparisons include: (a) validation and documentation overhead per receiving batch, which multiplies for products received in frequent small shipments; (b) operator labor time spent on mop-head changeover, which accumulates significantly for single-use products in high-frequency cleaning environments; (c) retraining costs when switching products, suppliers, or protocols; (d) risk-adjusted contamination event cost, which may be the largest single hidden cost in the model; (e) sterile product shelf-life expiry write-offs; and (f) the working-capital cost of carrying inventory to meet minimum order quantities.
4. How does validation documentation affect cleanroom mop total cost?
Validation documentation cost is driven by the number of receiving batches per year, not the number of units per batch. Each batch typically requires incoming inspection, COA review, documentation filing in the quality management system, and potentially sterility or particle-count verification. A disposable mop program with frequent shipments may generate significantly more validation cycles per year than a reusable program with fewer, larger batches covering the same number of cleaning events. This means that validation overhead per cleaning event is typically lower in a reusable mop program, all else being equal. For sterile mops, the overhead is higher due to sterility assurance documentation requirements.
5. When does a more expensive cleanroom mop actually cost less over time?
A more expensive cleanroom mop typically costs less over time when three conditions are met simultaneously: (1) the service life (number of uses per mop) is long enough that the per-use acquisition cost is lower than the alternative; (2) the validation overhead per cleaning event is lower because fewer batches are received per year; and (3) the labor cost of changeover is lower because fewer mop-head changes are required. This pattern commonly appears when comparing a higher-quality reusable mop (50–200+ uses) against a lower-unit-price disposable (1 use). At cleaning volumes above a facility-specific breakeven point, the higher-unit-price reusable option may produce a lower total annual cost. The exact breakeven depends on the ratio of unit prices, the validated service life, and the facility’s validation and labor cost structure.
6. How do I build a business case for upgrading cleanroom mop quality?
Build the business case by running a six-dimension TCO comparison between the current product and the proposed upgrade. Present the analysis as a cost-per-cleaning-event comparison, not a unit-price comparison. Include: (a) the per-use acquisition cost difference; (b) the annual validation overhead savings from fewer receiving batches; (c) the labor savings from reduced changeover frequency; (d) a risk-adjusted estimate of contamination event cost reduction based on improved quality consistency or particle-shedding performance; and (e) the logistics savings from lower shipment frequency. Present the results as a total annual cost comparison for the current fiscal year, and include a sensitivity analysis showing that the conclusion holds under different usage-volume scenarios.
7. Does sterile packaging significantly increase the total cost of cleanroom mop ownership?
Yes, sterile packaging adds cost to cleanroom mop ownership through several channels: (a) higher unit acquisition cost due to the sterilization process (typically gamma irradiation) and sterile packaging materials; (b) sterility assurance documentation that must accompany each batch; (c) shelf-life management, as sterile products carry expiry dates and expired stock must be written off; and (d) aseptic transfer procedures that may add operator time during use. Whether this additional cost is justified depends on the cleanroom grade. For Grade A/ISO 5 aseptic processing zones, regulatory requirements (EU GMP Annex 1 and equivalent) typically mandate sterile cleaning tools regardless of cost. For Grade C/D environments, non-sterile mops are generally acceptable, and the sterile premium may not be necessary. The TCO impact of sterile packaging is most significant in facilities that consume sterile mops at high volume in lower-grade areas where sterility is not a regulatory requirement.
8. What non-cost factors should override a TCO-based procurement decision?
Non-cost factors that may override a TCO analysis include: (a) regulatory requirements that mandate specific product characteristics (e.g., sterile tools for Grade A, per Annex 1); (b) contamination risk tolerance that differs between sterile injectable manufacturing and non-sterile solid dosage forms; (c) supplier qualification status — an already-audited and approved supplier carries lower switching cost and risk than a new entrant; (d) existing SOP compatibility, where switching mop types would trigger costly SOP revision and revalidation; (e) supply chain resilience — the lowest-TCO single-source option may represent unacceptable supply continuity risk; and (f) material and construction quality requirements that are justified by cleanroom performance needs rather than cost arithmetic alone.
Ready to Evaluate Your Cleanroom Mop Program’s Total Cost?
A unit-price comparison tells you what you will pay on the purchase order. A six-dimension TCO analysis tells you what the program will cost your facility over a full operating year. Discuss your facility’s usage parameters with our team — we can help you compare total cost across configurations and build the business case for a procurement decision that reflects total value, not just the line-item price.
ਬੇਦਾਅਵਾ: TCO analysis depends on facility-specific parameters including cleanroom grade, cleaning frequency, SOP requirements, labor rates, and procurement volume. No single TCO number applies universally across all GMP environments. The framework and examples provided in this article are illustrative and should be adapted to your facility’s specific operating parameters.